Exam 8: Producers in the Long Run
Exam 1: Economic Issues and Concepts107 Questions
Exam 2: Economic Theories, Data, and Graphs114 Questions
Exam 3: Demand, Supply, and Price134 Questions
Exam 4: Elasticity124 Questions
Exam 5: Markets in Action114 Questions
Exam 6: Consumer Behaviour119 Questions
Exam 7: Producers in the Short Run120 Questions
Exam 8: Producers in the Long Run110 Questions
Exam 9: Competitive Markets125 Questions
Exam 10: Monopoly, Cartels, and Price Discrimination110 Questions
Exam 11: Imperfect Competition110 Questions
Exam 12: Economic Efficiency and Public Policy109 Questions
Exam 13: How Factor Markets Work123 Questions
Exam 14: Labour Markets92 Questions
Exam 15: Interest Rates and the Capital Market90 Questions
Exam 16: Market Failures and Government Intervention110 Questions
Exam 17: The Economics of Environmental Protection110 Questions
Exam 18: Taxation and Public Expenditure110 Questions
Exam 33: The Gains From International Trade112 Questions
Exam 34: Trade Policy114 Questions
Select questions type
A profit- maximizing firm will increase its use of capital and decrease its use of labour when the
(Multiple Choice)
4.8/5  (33)
(33)
A profit- maximizing firm with variable labour and capital will always produce
(Multiple Choice)
4.9/5 (34)
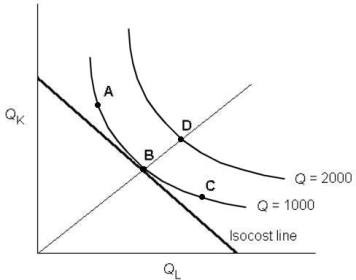 FIGURE 8- 4
-Refer to Figure 8- 4. A firm that is producing an output of 2000 units will minimize its costs at point
FIGURE 8- 4
-Refer to Figure 8- 4. A firm that is producing an output of 2000 units will minimize its costs at point
(Multiple Choice)
4.9/5 (49)
The figure below shows the isocost lines and the isoquant map for a firm producing golf tees. 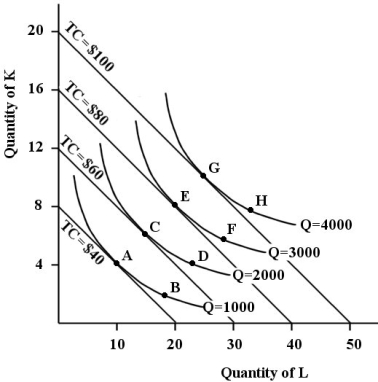 FIGURE 8- 6
-Refer to Figure 8- 6. The cost- minimizing factor combination for producing 2000 golf tees is
FIGURE 8- 6
-Refer to Figure 8- 6. The cost- minimizing factor combination for producing 2000 golf tees is
(Multiple Choice)
4.8/5 (35)
Assume a firm is using 10 units of labour and 10 units of capital and is producing 10 units of output per hour. Now both inputs are doubled, resulting in output rising to 18 units per hour. The firm is experiencing
(Multiple Choice)
4.7/5 (44)
Consider a firm that uses only labour and capital. At the present use of labour and capital, the MP of labour is two times the MP of capital, and the price of labour is two times the price of capital. In order to minimize its costs, the firm should
(Multiple Choice)
4.8/5 (35)
The figure below shows a family of cost curves for a firm. The subscripts 1, 2, and 3 for the SRATC curves refer to different plant sizes. 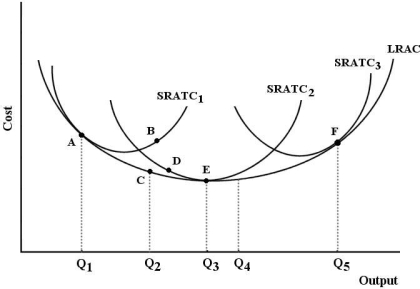 FIGURE 8- 3
-Refer to Figure 8- 3. Should this firm ever consider moving from point E (output level Q3 on SRATC2) to point F (output level Q5 on SRATC3)?
FIGURE 8- 3
-Refer to Figure 8- 3. Should this firm ever consider moving from point E (output level Q3 on SRATC2) to point F (output level Q5 on SRATC3)?
(Multiple Choice)
4.9/5 (42)
Isocost lines are downward sloping straight lines, reflecting
(Multiple Choice)
4.7/5 (31)
Increasing returns to scale for a firm is shown graphically by
(Multiple Choice)
4.7/5 (40)
Any point representing a cost and output combination that is below the long- run average cost curve
(Multiple Choice)
4.9/5 (28)
The following table shows the marginal products of capital (K) and labour (L) for various methods for Firm ABC to produce 1000 toys per day. Production Method MPK MPL A 50 4 B 45 8 C 40 12 D 35 16 E 30 20 F 25 24 G 20 28 TABLE 8- 2
-Refer to Table 8- 2. As this firm switches from production method A to production method G, production is
(Multiple Choice)
4.8/5 (45)
The slope of a firm's isocost line is equal to the ratio of
(Multiple Choice)
4.9/5 (42)
Assume a firm is using 10 units of capital and 10 units of labour to produce 10 widgets per hour. By doubling both inputs the result is a doubling of output. This firm is experiencing
(Multiple Choice)
4.8/5 (43)
The table below shows the number of units of labour and capital used in 4 alternative production techniques for producing 1000 widgets per month. Technique A B C D Labour 25 35 50 30 Capital 50 35 25 60 TABLE 8- 1
-Refer to Table 8- 1. Which production technique is obviously technically inefficient?
(Multiple Choice)
4.8/5 (48)
 FIGURE 8- 4
-Refer to Figure 8- 4. The firm is initially producing 2000 units and minimizing its production cost at point D. Suppose the prices of capital and labour each rise by 10 percent. If the firm wishes to continue producing the same level of output it will
FIGURE 8- 4
-Refer to Figure 8- 4. The firm is initially producing 2000 units and minimizing its production cost at point D. Suppose the prices of capital and labour each rise by 10 percent. If the firm wishes to continue producing the same level of output it will
(Multiple Choice)
4.9/5 (40)
Consider a firm that uses only labour and capital as inputs. At the present use of labour and capital, the MP of labour is four times the MP of capital, and the price of labour is twice the price of capital. In order to minimize its costs, the firm should
(Multiple Choice)
4.9/5 (39)
The figure below shows a family of cost curves for a firm. The subscripts 1, 2, and 3 for the SRATC curves refer to different plant sizes.  FIGURE 8- 3
-Refer to Figure 8- 3. The minimum efficient scale is achieved by this firm at output level
FIGURE 8- 3
-Refer to Figure 8- 3. The minimum efficient scale is achieved by this firm at output level
(Multiple Choice)
4.7/5 (35)
Filters
- Essay(0)
- Multiple Choice(0)
- Short Answer(0)
- True False(0)
- Matching(0)