Exam 5: Markets in Action
Exam 1: Economic Issues and Concepts107 Questions
Exam 2: Economic Theories, Data, and Graphs114 Questions
Exam 3: Demand, Supply, and Price134 Questions
Exam 4: Elasticity124 Questions
Exam 5: Markets in Action114 Questions
Exam 6: Consumer Behaviour119 Questions
Exam 7: Producers in the Short Run120 Questions
Exam 8: Producers in the Long Run110 Questions
Exam 9: Competitive Markets125 Questions
Exam 10: Monopoly, Cartels, and Price Discrimination110 Questions
Exam 11: Imperfect Competition110 Questions
Exam 12: Economic Efficiency and Public Policy109 Questions
Exam 13: How Factor Markets Work123 Questions
Exam 14: Labour Markets92 Questions
Exam 15: Interest Rates and the Capital Market90 Questions
Exam 16: Market Failures and Government Intervention110 Questions
Exam 17: The Economics of Environmental Protection110 Questions
Exam 18: Taxation and Public Expenditure110 Questions
Exam 33: The Gains From International Trade112 Questions
Exam 34: Trade Policy114 Questions
Select questions type
Consider the following demand and supply schedules for some agricultural commodity. Price Quantity Supplied Quantity Demanded \ 10 300 1100 \ 30 500 900 \ 50 700 700 \ 70 900 500 \ 90 1100 300 \ 110 1300 100 TABLE 5- 2
-Refer to Table 5- 2. Consider the market- clearing equilibrium. If the government then required that production increase to 900 units, the deadweight loss that is created is equal to
Free
(Multiple Choice)
4.8/5  (40)
(40)
Correct Answer: Verified
B
Which of the following is an example of a black- market transaction?
Free
(Multiple Choice)
4.8/5 (35)
Correct Answer:Verified
C
Who are likely to be the biggest beneficiaries of rent controls?
Free
(Multiple Choice)
4.8/5 (32)
Correct Answer:Verified
E
Consider the market for any agricultural commodity for which there exists a binding output quota and demand is inelastic. One outcome of this situation is that
(Multiple Choice)
4.8/5 (26)
Assuming that the long- run supply of housing is highly elastic, the imposition of binding rent controls will lead to
(Multiple Choice)
4.7/5 (42)
Suppose the government decides to eliminate a binding price floor that it had previously imposed on a particular good. It can be expected that
(Multiple Choice)
4.8/5 (35)
In general (and in the absence of market failures), economic surplus will be maximized and economic efficiency will be achieved
(Multiple Choice)
5.0/5 (41)
If the free- market equilibrium price for some product is $25, then a legal price ceiling set at $15 will bring about
(Multiple Choice)
4.8/5 (36)
A price ceiling set below the free- market equilibrium price will result in
(Multiple Choice)
4.8/5 (33)
If a specific market is quite small relative to the entire economy
(Multiple Choice)
4.9/5 (34)
If a binding price ceiling is in place and if the demand curve for the product shifts rightward, one consequence would be
(Multiple Choice)
4.8/5 (30)
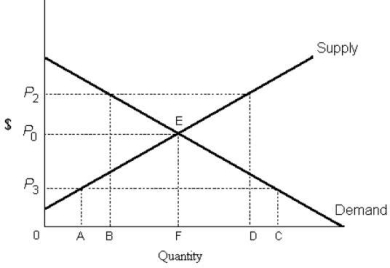 FIGURE 5- 1
-Refer to Figure 5- 1. If the diagram applies to the market for rental housing and P3 represents the maximum rent that can be charged, then
FIGURE 5- 1
-Refer to Figure 5- 1. If the diagram applies to the market for rental housing and P3 represents the maximum rent that can be charged, then
(Multiple Choice)
4.9/5 (32)
If a binding price floor is in place and if the demand curve for the product shifts rightward, one consequence would be
(Multiple Choice)
4.8/5 (37)
Consider the market for iron ore, an important industrial input. Suppose the government sets a price floor below the free- market equilibrium price. The result will be
(Multiple Choice)
4.7/5 (43)
 FIGURE 5- 3
-Refer to Figure 5- 3. P3 represents a price imposed by the government. The result would be
FIGURE 5- 3
-Refer to Figure 5- 3. P3 represents a price imposed by the government. The result would be
(Multiple Choice)
4.9/5 (36)
In free and competitive markets, shortages are eliminated by
(Multiple Choice)
4.7/5 (42)
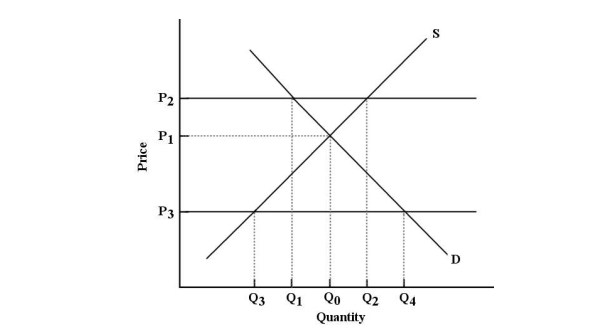 FIGURE 5- 3
-Refer to Figure 5- 3. To be effective, a price floor must lie
FIGURE 5- 3
-Refer to Figure 5- 3. To be effective, a price floor must lie
(Multiple Choice)
4.9/5 (34)
Filters
- Essay(0)
- Multiple Choice(0)
- Short Answer(0)
- True False(0)
- Matching(0)