Exam 4: Elasticity
Exam 1: Economic Issues and Concepts107 Questions
Exam 2: Economic Theories, Data, and Graphs114 Questions
Exam 3: Demand, Supply, and Price134 Questions
Exam 4: Elasticity124 Questions
Exam 5: Markets in Action114 Questions
Exam 6: Consumer Behaviour119 Questions
Exam 7: Producers in the Short Run120 Questions
Exam 8: Producers in the Long Run110 Questions
Exam 9: Competitive Markets125 Questions
Exam 10: Monopoly, Cartels, and Price Discrimination110 Questions
Exam 11: Imperfect Competition110 Questions
Exam 12: Economic Efficiency and Public Policy109 Questions
Exam 13: How Factor Markets Work123 Questions
Exam 14: Labour Markets92 Questions
Exam 15: Interest Rates and the Capital Market90 Questions
Exam 16: Market Failures and Government Intervention110 Questions
Exam 17: The Economics of Environmental Protection110 Questions
Exam 18: Taxation and Public Expenditure110 Questions
Exam 33: The Gains From International Trade112 Questions
Exam 34: Trade Policy114 Questions
Select questions type
 FIGURE 4- 2
-Refer to Figure 4- 2. The price elasticity of demand is continuously increasing as the price falls in part(s)
FIGURE 4- 2
-Refer to Figure 4- 2. The price elasticity of demand is continuously increasing as the price falls in part(s)
(Multiple Choice)
4.7/5  (35)
(35)
Income elasticity measures the change in quantity demanded of some product with respect to changes in
(Multiple Choice)
4.8/5 (35)
-Refer to Table 4- 2. Using the data provided to plot the demand curve for ski tickets results in a
Demand curve. Price elasticity along this demand curve is therefore _ as price is falling.
(Multiple Choice)
4.8/5 (28)
As the price for some product increases from $4.00 to $5.00 per unit, quantity demanded decreases from 400 to 300 units per month. For this segment of the demand curve, the price elasticity of demand is
(Multiple Choice)
4.8/5 (37)
Suppose the cross- elasticity of demand for two goods, X and Y, is positive. If the price of Y falls, then quantity demanded will
(Multiple Choice)
4.7/5 (43)
If the price elasticity of demand is 0.5, then a 10 percent increase in price results in a
(Multiple Choice)
4.8/5 (32)
A value of zero for the elasticity of supply of some product implies that
(Multiple Choice)
4.9/5 (33)
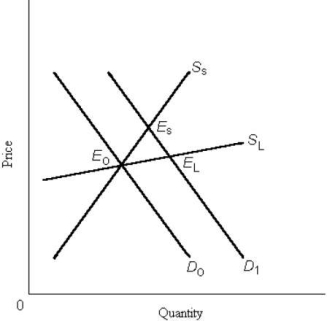 FIGURE 4- 3
-Refer to Figure 4- 3, which shows a demand shift and the short- run and long- run supply curves for some product. The diagram illustrates the general principle that
FIGURE 4- 3
-Refer to Figure 4- 3, which shows a demand shift and the short- run and long- run supply curves for some product. The diagram illustrates the general principle that
(Multiple Choice)
4.8/5 (39)
The formula for the own- price elasticity of demand for a commodity can be written as which of the following?
(Multiple Choice)
4.8/5 (41)
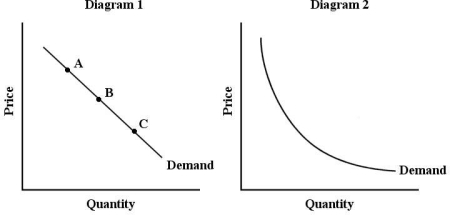 FIGURE 4- 1
-Refer to Figure 4- 1, which shows two demand curves, one linear and the other a rectangular hyperbola. In diagram 1, the price elasticity of demand
FIGURE 4- 1
-Refer to Figure 4- 1, which shows two demand curves, one linear and the other a rectangular hyperbola. In diagram 1, the price elasticity of demand
(Multiple Choice)
4.8/5 (45)
Suppose the supply curve for breakfast cereals is upward sloping. Suppose also that as average household income increases we observe a fall in the price of breakfast cereal. We can conclude that breakfast cereal is a(n)
(Multiple Choice)
4.7/5 (52)
If the total expenditure on automobiles increases when the price of automobiles rises, the price elasticity of demand for automobiles is
(Multiple Choice)
4.9/5 (33)
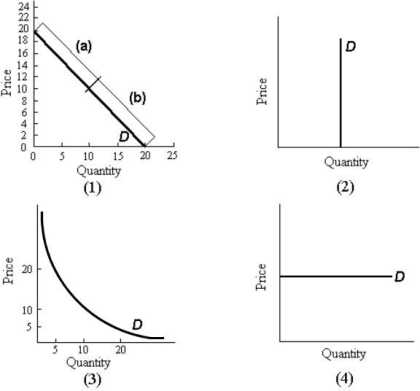 FIGURE 4- 2
-Refer to Figure 4- 2. In part 1 of the figure, the elasticity of demand over the price range $14 to $16 is
FIGURE 4- 2
-Refer to Figure 4- 2. In part 1 of the figure, the elasticity of demand over the price range $14 to $16 is
(Multiple Choice)
4.9/5 (39)
A perfectly horizontal demand curve shows that the own- price elasticity of demand is
(Multiple Choice)
4.9/5 (30)
Consider two demand curves and the same price change for both. If the resulting percentage change in quantity demanded is greater for one (D1) than the other (D2), we can conclude
(Multiple Choice)
4.8/5 (41)
 FIGURE 4- 2
-Refer to Figure 4- 2. In part 2 of the figure, the elasticity of demand is
FIGURE 4- 2
-Refer to Figure 4- 2. In part 2 of the figure, the elasticity of demand is
(Multiple Choice)
4.9/5 (38)
Nancy's income has just risen from $950 per week to $1,050 per week. As a result, she decides to double the number of movies she attends each week. Nancy's demand for movies is
(Multiple Choice)
4.8/5 (40)
 FIGURE 4- 2
-Refer to Figure 4- 2. As price decreases, total expenditure remains constant in diagram(s)
FIGURE 4- 2
-Refer to Figure 4- 2. As price decreases, total expenditure remains constant in diagram(s)
(Multiple Choice)
4.9/5 (32)
Given that elasticity of supply changes over time, in the short run an increase in demand will generally cause
(Multiple Choice)
4.7/5 (37)
Suppose you are advising the government on changes in the gasoline market. The current price is
$1.00 per litre and the quantity demanded is 2.5 million litres per day. Long- run price elasticity of demand is constant at 0.8. If the supply of gasoline is reduced so that the price rises to $1.50 per litre, then quantity demanded is predicted to fall in the long run by
(Multiple Choice)
4.9/5 (40)
Filters
- Essay(0)
- Multiple Choice(0)
- Short Answer(0)
- True False(0)
- Matching(0)