Exam 3: Measuring and Using Demand
Exam 1: Managerial Economics and Decision Making90 Questions
Exam 2: Demand and Supply207 Questions
Exam 3: Measuring and Using Demand124 Questions
Exam 4: Production and Costs138 Questions
Exam 5: Perfect Competition120 Questions
Exam 6: Monopoly and Monopolistic Competition149 Questions
Exam 7: Cartels and Oligopoly114 Questions
Exam 8: Game Theory and Oligopoly100 Questions
Exam 9: A Managers Guide to Antitrust Policy175 Questions
Exam 10: Advanced Pricing Decisions120 Questions
Exam 11: Decisions About Vertical Integration and Distribution113 Questions
Exam 12: Decisions About Production, Products, and Location175 Questions
Exam 13: Marketing Decisions: Advertising and Promotion175 Questions
Exam 14: Business Decisions Under Uncertainty200 Questions
Exam 15: Managerial Decisions About Information137 Questions
Exam 16: Using Present Value to Make Multi-Period Managerial Decisions106 Questions
Select questions type
 The table above shows a sample of actual data used to estimate the demand function for Happy Clams seafood dinners.
-Refer to the table above. Excel estimates the demand function for Happy Clams seafood dinners to be: Qd = 1,200 - (20.50 × P). Which of the following statements is true?
The table above shows a sample of actual data used to estimate the demand function for Happy Clams seafood dinners.
-Refer to the table above. Excel estimates the demand function for Happy Clams seafood dinners to be: Qd = 1,200 - (20.50 × P). Which of the following statements is true?
(Multiple Choice)
4.8/5  (28)
(28)
The table above shows a sample of actual data used to estimate the demand function for Happy Clams seafood dinners.
-Refer to the table above. Excel estimates the demand function for Happy Clams seafood dinners to be: Qd = 1,200 - (20.50 × P). Which of the following statements is true?
(Multiple Choice)
4.7/5 (39)
You are the owner of a firm that makes generic paper products. You estimate the income elasticity for your paper towels to be - 1.5. An economic recession will have which of the following effects on the demand for your paper products?
(Multiple Choice)
4.8/5 (32)
Economists have defined the price elasticity of demand using percentages because percentages do not depend on the unit of measurement.
(True/False)
4.7/5 (31)
You are the owner of a construction company that specializes in new beach- front condominiums. If the income elasticity for your condominiums is 4.25, all of the following statements are true except which one?
(Multiple Choice)
4.8/5 (35)
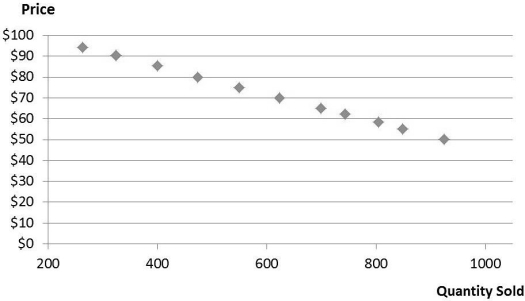 The scatter diagram above shows the actual data for the price and quantity demanded of a product.
-Refer to the scatter diagram above. The diagram suggests which of the following?
The scatter diagram above shows the actual data for the price and quantity demanded of a product.
-Refer to the scatter diagram above. The diagram suggests which of the following?
(Multiple Choice)
4.7/5 (36)
The table above shows a sample of actual data used to estimate the demand function for Happy Clams seafood dinners.
-Refer to the table above. Excel estimates the demand function for Happy Clams seafood dinners to be: Qd = 1,200 - (20.50 × P). Which of the following statements is true?
(Multiple Choice)
4.8/5 (42)
Using Excel, Best Paints estimates the log- linear weekly demand function for their gallon sized paints to be ln Qd = 16.23 - (1.85 × ln P). At a price of $20, what is the predicted natural logarithm of the quantity (ln Q )?
(Multiple Choice)
4.7/5 (30)
If Excel estimated the 95 percent confidence interval for a slope coefficient for the price b^ to run from - 5.50 to - 2.30, it is not possible for the true slope coefficient to be equal to - 5.75.
(True/False)
4.9/5 (32)
You are the owner of a restaurant located in a beach resort in Hawaii and want to use regression analysis to estimate the demand for your fresh seafood dinners. You have collected data on the daily quantity of seafood dinners sold over the last summer season. In order to correctly specify your regression equation, all of the following variables should be considered except which one?
(Multiple Choice)
4.8/5 (43)
If Excel estimates the demand function for a product to be: Qd = 1,500 - (5 × P)and a price of $125 is charged, the predicted quantity demanded for the product is 875.
(True/False)
4.8/5 (34)
Big Poppa's BBQ Sandwiches is a local restaurant specializing in BBQ sandwiches. Using Excel, Big Poppa's estimates the weekly demand function for its BBQ sandwiches to be Qd = 1,576.55 - (25.50 × P). The estimated regression equation suggests which of the following is true?
(Multiple Choice)
4.9/5 (32)
Big Poppa's BBQ Sandwiches is a local restaurant specializing in BBQ sandwiches. Using Excel, Big Poppa's estimates the weekly demand function for its BBQ sandwiches to be Qd = 1,576.55 - (25.50 × P). If Big Poppa's charges $15 per sandwich, the predicted quantity of sandwiches sold is________
(Multiple Choice)
4.8/5 (43)
Using Excel, the manager of Quick Breaks Coffees has estimated the daily demand function for its regular coffees; the results are shown in the table above. If a price of $5 is charged for the coffees, the predicted quantity demanded is ___________.
(Multiple Choice)
4.8/5 (35)
Using Excel, Big Pies Pizzas estimates the log- linear weekly demand function for their pizza to be ln Qd = 8.23 - (1.50 × ln P). Which of the following statements is true?
(Multiple Choice)
4.9/5 (34)
A regression analysis estimated using Ordinary Least Squares (OLS)does all of the following except which one?
(Multiple Choice)
4.8/5 (39)
Big City Java is a local coffee bar. Using Excel, the manager of Big City Java estimates the weekly demand function for their grand mocha coffees to be Qd = 650 - (15.25 × P). The estimated regression equation suggests that if Big City Java decreased its price of grana mocha coffees from $7 to $5, the predicted quantity demanded of coffees would _________.
(Multiple Choice)
4.8/5 (37)
If the estimated slope coefficient is  = - 5.45 and the standard error for the slope coefficient is 1.75, which of the following is true using a 95 percent confidence level?
(Multiple Choice)
4.9/5 (32)
For any change in a business cycle, the percentage change in demand for a good with an income elasticity of 0.50 will be larger than the percentage change in demand for a good with an income elasticity of 0.25.
(True/False)
4.7/5 (38)
If a 4 percent increase in the price of a good leads to a 1 percent decrease in the quantity demanded, the price elasticity of demand for the good equals________ .
(Multiple Choice)
4.8/5 (33)
Filters
- Essay(0)
- Multiple Choice(0)
- Short Answer(0)
- True False(0)
- Matching(0)