Exam 10: Regression Analysis: Estimating Relationships
Exam 1: Introduction to Business Analytics24 Questions
Exam 2: Describing the Distribution of a Variable73 Questions
Exam 3: Finding Relationships Among Variables56 Questions
Exam 4: Business Intelligence Bifor Data Analysis62 Questions
Exam 5: Probability and Probability Distributions132 Questions
Exam 6: Decision Making Under Uncertainty79 Questions
Exam 7: Sampling and Sampling Distributions78 Questions
Exam 8: Confidence Interval Estimation60 Questions
Exam 9: Hypothesis Testing70 Questions
Exam 10: Regression Analysis: Estimating Relationships80 Questions
Exam 11: Regression Analysis: Statistical Inference69 Questions
Exam 12: Time Series Analysis and Forecasting95 Questions
Exam 13: Introduction to Optimization Modeling70 Questions
Exam 14: Optimization Models87 Questions
Exam 15: Introduction to Simulation Modeling58 Questions
Exam 16: Simulation Models59 Questions
Exam 17: Data Mining30 Questions
Exam 18: Analysis of Variance and Experimental Design24 Questions
Exam 19: Statistical Process Control24 Questions
Select questions type
A regression analysis between weight (Y in pounds)and height (X in inches)resulted in the following least squares line:  = 140 + 5X.This implies that if the height is increased by 1 inch,the weight is expected to increase on average by 5 pounds.
(True/False)
4.8/5  (35)
(35)
In a multiple regression problem with two explanatory variables if,the fitted regression equation is 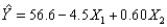 then the estimated value of Y when
  and
and  is 49.4.
(True/False)
4.8/5 (31)
In regression analysis,the variables used to help explain or predict the response variable are called the _____ variables.
(Multiple Choice)
4.9/5 (38)
The primary purpose of a nonlinear transformation is to "straighten out" the data on a scatterplot.
(True/False)
4.8/5 (41)
Cross-sectional data are usually data gathered from approximately the same period of time from a population.
(True/False)
4.9/5 (32)
In multiple regression,the coefficients reflect the expected change in _____ by one unit.
(Multiple Choice)
4.9/5 (34)
For the multiple regression model 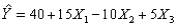 ,if
,if  were to increase by 5 units,holding
  and
and  constant,the value of Y would be expected to decrease by 50 units.
(True/False)
4.9/5 (40)
If the regression equation includes anything other than a constant plus the sum of products of constants and variables,the model will not be linear.
(True/False)
4.8/5 (35)
In every regression study there is a single variable that we are trying to explain or predict.This is called the response variable or dependent variable.
(True/False)
4.7/5 (31)
In a multiple regression analysis with three explanatory variables,suppose that there are 60 observations and the sum of the residuals squared is 28.The standard error of estimate must be 0.7071.
(True/False)
4.8/5 (34)
Given the least squares regression line,  ,which statement is true?
(Multiple Choice)
4.8/5 (44)
The adjusted R2 is adjusted for the number of explanatory variables in a regression equation,and it has the same interpretation as the standard R2.
(True/False)
4.7/5 (37)
Data collected from approximately the same period of time from a cross-section of a population are called _____ data.
(Multiple Choice)
4.8/5 (24)
The least squares line is the line that minimizes the sum of the residuals.
(True/False)
4.7/5 (36)
In regression analysis,we can often use the standard error of estimate  to judge which of several potential regression equations is the most useful.
(True/False)
4.9/5 (35)
Regression analysis can be applied equally well to cross-sectional and time series data.
(True/False)
4.9/5 (37)
R2 can only increase when extra explanatory variables are added to a multiple regression model.
(True/False)
4.9/5 (39)
Filters
- Essay(0)
- Multiple Choice(0)
- Short Answer(0)
- True False(0)
- Matching(0)