Exam 10: Regression Analysis: Estimating Relationships
Exam 1: Introduction to Business Analytics24 Questions
Exam 2: Describing the Distribution of a Variable73 Questions
Exam 3: Finding Relationships Among Variables56 Questions
Exam 4: Business Intelligence Bifor Data Analysis62 Questions
Exam 5: Probability and Probability Distributions132 Questions
Exam 6: Decision Making Under Uncertainty79 Questions
Exam 7: Sampling and Sampling Distributions78 Questions
Exam 8: Confidence Interval Estimation60 Questions
Exam 9: Hypothesis Testing70 Questions
Exam 10: Regression Analysis: Estimating Relationships80 Questions
Exam 11: Regression Analysis: Statistical Inference69 Questions
Exam 12: Time Series Analysis and Forecasting95 Questions
Exam 13: Introduction to Optimization Modeling70 Questions
Exam 14: Optimization Models87 Questions
Exam 15: Introduction to Simulation Modeling58 Questions
Exam 16: Simulation Models59 Questions
Exam 17: Data Mining30 Questions
Exam 18: Analysis of Variance and Experimental Design24 Questions
Exam 19: Statistical Process Control24 Questions
Select questions type
Which of the following is an example of a nonlinear regression model?
(Multiple Choice)
4.9/5  (31)
(31)
In the multiple regression model 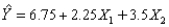 we interpret X1 as follows: holding X2 constant,if X1 increases by 1 unit,then the expected value of Y will increase by 9 units.
(True/False)
4.8/5 (37)
The coefficients for logarithmically transformed explanatory variables should be interpreted as the percent change in the dependent variable for a 1% percent change in the explanatory variable.
(True/False)
4.9/5 (40)
A regression analysis between X = sales (in $1000s)and Y = advertising ($)resulted in the following least squares line:  = 84 +7X.This implies that if there is no advertising,then the predicted amount of sales (in dollars)is $84,000.
(True/False)
4.7/5 (42)
A logarithmic transformation of the response variable Y is often useful when the distribution of Y is symmetric.
(True/False)
4.8/5 (32)
Correlation is measured on a scale from 0 to 1,where 0 indicates no linear relationship between two variables,and 1 indicates a perfect linear relationship.
(True/False)
4.9/5 (32)
When the scatterplot appears as a shapeless swarm of points,this can indicate that there is no relationship between the response variable Y and the explanatory variable X,or at least none worth pursuing.
(True/False)
4.9/5 (39)
The regression line 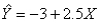 has been fitted to the data points (28,60),(20,50),(10,18),and (25,55).The sum of the squared residuals will be
(Multiple Choice)
4.8/5 (25)
The covariance is not used as much as the correlation because
(Multiple Choice)
4.9/5 (40)
In a simple linear regression problem,suppose that  = 12.48 and
  = 124.8.Then
  = 0.90.
(True/False)
4.7/5 (31)
In a nonlinear transformation of data,the Y variable or the X variables may be transformed,but not both.
(True/False)
4.8/5 (36)
If a scatterplot of residuals shows a parabola shape,then a logarithmic transformation may be useful in obtaining a better fit.
(True/False)
4.9/5 (34)
To help explain or predict the response variable in every regression study,we use one or more explanatory variables.These variables are also called response variables or independent variables.
(True/False)
4.9/5 (27)
In regression analysis,if there are several explanatory variables,it is called _____ regression.
(Multiple Choice)
4.9/5 (41)
Filters
- Essay(0)
- Multiple Choice(0)
- Short Answer(0)
- True False(0)
- Matching(0)