Exam 6: Powerpoint 2013 : Enhancing Charts
Exam 1: Word 2013 : Creating and Formatting Tables48 Questions
Exam 2: Word 2013 : Illustrating Documents With Graphics45 Questions
Exam 3: Word 2013 : Working With Themes and Building Blocks56 Questions
Exam 4: Word 2013 : Merging Word Documents57 Questions
Exam 5: Powerpoint 2013 : Working With Advanced Tools and Masters50 Questions
Exam 6: Powerpoint 2013 : Enhancing Charts52 Questions
Exam 7: Powerpoint 2013 : Inserting Graphics, Media, and Objects54 Questions
Exam 8: Powerpoint 2013 : Using Advanced Features52 Questions
Exam 9: Integration : Integrating Word and Excel38 Questions
Exam 10: Integration : Integrating Word, Excel, and Access40 Questions
Exam 11: Integration : Integrating Word, Excel, Access, and Powerpoint33 Questions
Exam 12: Excel 2013 : Analyzing Data Using Formulas73 Questions
Exam 13: Excel 2013 : Managing Workbook Data74 Questions
Exam 14: Excel 2013 : Managing Data Using Tables68 Questions
Exam 15: Excel 2013 : Analyzing Table Data65 Questions
Exam 16: Access 2013 : Modifying the Database Structure76 Questions
Exam 17: Access 2013 : Improving Queries77 Questions
Exam 18: Access 2013 : Enhancing Forms79 Questions
Exam 19: Access 2013 : Analyzing Data With Reports78 Questions
Exam 20: Working in the Cloud50 Questions
Select questions type
The object you create with a source program is called the destination file.
Free
(True/False)
4.9/5  (40)
(40)
Correct Answer: Verified
False
Exit animation effects cause an object to leave the slide._________________________
Free
(True/False)
4.9/5 (35)
Correct Answer:Verified
True
You can change the color and effects of chart elements by applying one of the ____________________ in the Chart Styles gallery.
(Short Answer)
4.9/5 (37)
____________________ gridlines identify minor units on the axis and are usually identified by tick marks.
(Short Answer)
4.8/5 (31)
If you animate a chart's data markers as a series,the entire data series is animated as a group.
(True/False)
4.9/5 (37)
You can enter a value from ____% to 100% in the Series Overlap text box.
(Multiple Choice)
4.8/5 (24)
You can animate data markers of the same color individually ____.
(Multiple Choice)
4.8/5 (28)
Major ____________________ identify major units on the axis and are usually identified by tick marks.
(Short Answer)
4.9/5 (28)
____ are small lines of measurement that intersect an axis and identify the categories,values,or series in a chart.
(Multiple Choice)
4.9/5 (33)
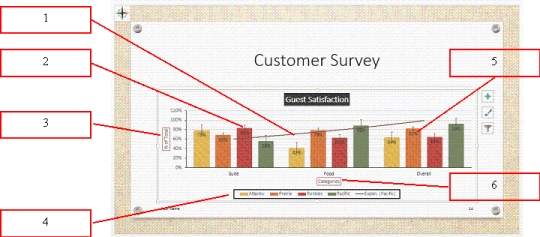 -In the accompanying figure,number 1 is pointing to the horizontal axis title.
(True/False)
4.9/5 (34)
Click the ____ button in the Chart Layouts group to choose a chart layout from the Layout gallery.
(Multiple Choice)
4.8/5 (38)
Linear Up is a type of ____ that you can apply to data series markers.
(Multiple Choice)
5.0/5 (37)
When you create an Excel chart in PowerPoint,you can perform advanced commands on Excel data in the worksheet window in PowerPoint.
(True/False)
4.9/5 (39)
Filters
- Essay(0)
- Multiple Choice(0)
- Short Answer(0)
- True False(0)
- Matching(0)