Exam 19: The Logic of Individual Choice: the Foundation of Supply and Demand
Exam 1: Economics and Economic Reasoning121 Questions
Exam 2: The Production Possibility Model, Trade, and Globalization111 Questions
Exam 3: Economic Institutions144 Questions
Exam 4: Supply and Demand151 Questions
Exam 5: Using Supply and Demand136 Questions
Exam 6: Describing Supply and Demand: Elasticities176 Questions
Exam 7: Taxation and Government Intervention169 Questions
Exam 8: Market Failure Versus Government Failure160 Questions
Exam 9: Comparative Advantage, Exchange Rates, and Globalization107 Questions
Exam 10: International Trade Policy82 Questions
Exam 11: Production and Cost Analysis I160 Questions
Exam 12: Production and Cost Analysis II129 Questions
Exam 13: Perfect Competition137 Questions
Exam 14: Monopoly and Monopolistic Competition231 Questions
Exam 15: Oligopoly and Antitrust Policy111 Questions
Exam 16: Real-World Competition and Technology86 Questions
Exam 17: Work and the Labor Market130 Questions
Exam 18: Who Gets What the Distribution of Income100 Questions
Exam 19: The Logic of Individual Choice: the Foundation of Supply and Demand134 Questions
Exam 20: Game Theory, Strategic Decision Making, and Behavioral Economics76 Questions
Exam 21: Thinking Like a Modern Economist67 Questions
Exam 22: Behavioral Economics and Modern Economic Policy87 Questions
Exam 23: Microeconomic Policy, Economic Reasoning, and Beyond111 Questions
Select questions type
Diminishing marginal utility implies that as an individual consumes more of a good, beyond some point another unit will add:
Free
(Multiple Choice)
4.9/5  (35)
(35)
Correct Answer: Verified
D
Refer to the graph shown. 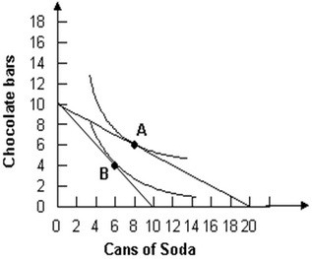 The diagram demonstrates that an increase in the price of soda will:
Free
(Multiple Choice)
4.9/5 (32)
Correct Answer:Verified
B
When people play the "ultimatum game," in which one person gets to decide how to split a sum of money by offering a share to another person and neither gets anything if the second person rejects the offer, the result is often that the first person offers:
Free
(Multiple Choice)
4.9/5 (37)
Correct Answer:Verified
B
Refer to the graph shown. Total utility is at its maximum at point: 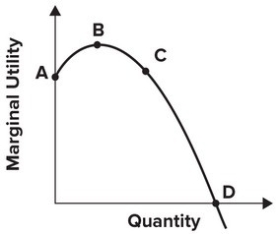
(Multiple Choice)
4.8/5 (37)
Using indifference curve analysis, you can identify the point at which a consumer maximizes utility where the slope of the:
(Multiple Choice)
4.9/5 (39)
The following table describes utility for consuming cans of soda. At what point does the law of diminishing marginal utility set in? Cans of Soda Total utility 1 14 2 30 3 47 4 57 5 56 6 50 7 42
(Multiple Choice)
4.9/5 (38)
Tom is maximizing utility by buying three packs of bubble gum and four packages of Skittles. Given diminishing marginal utility, if the price of Skittles rises, the principle of rational choice tells us that Tom will buy:
(Multiple Choice)
4.8/5 (35)
Some kids wait until the school year begins to buy their back-to-school clothes so that they are sure to fit in. Such follow-the-leader behavior is an example of what the text calls:
(Multiple Choice)
4.9/5 (43)
Using the indifference curve model, a demand for X curve is derived by allowing:
(Multiple Choice)
4.8/5 (36)
Behavioral economists have found that people are more willing to save if saving is the default option, as in the case in which they have to opt out of an automatic payroll deduction savings plan. Economists call this:
(Multiple Choice)
4.8/5 (38)
Suppose one Big Mac gives you a marginal utility of 500 and a second Big Mac gives you a marginal utility of 200. The total utility of buying (and eating) two Big Macs is:
(Multiple Choice)
4.7/5 (29)
Refer to the graph shown. 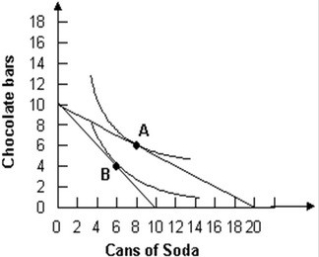 Assuming a consumer has $5 to spend, if a soda costs $0.50 and a chocolate bar costs $0.50, the consumer will optimally choose to consume:
(Multiple Choice)
4.7/5 (42)
If marginal utility is declining but still positive, total utility is increasing.
(True/False)
4.8/5 (41)
Suppose that the total utility of consuming the first piece of chewing gum in a packet is 30. This means that marginal utility of consuming the first piece of gum is:
(Multiple Choice)
4.9/5 (41)
A Big Mac meal costs $3.00 and gives you an additional 5 units of utility; a meal at the Four Seasons Hotel costs $27.00 and gives you an additional 45 units of utility. Based only on the information you have, using the theory of rational choice, you most likely would:
(Multiple Choice)
4.8/5 (39)
To calculate the marginal utility of consuming the Nth product:
(Multiple Choice)
4.9/5 (49)
Filters
- Essay(0)
- Multiple Choice(0)
- Short Answer(0)
- True False(0)
- Matching(0)