Exam 11: Production and Cost Analysis I
Exam 1: Economics and Economic Reasoning121 Questions
Exam 2: The Production Possibility Model, Trade, and Globalization111 Questions
Exam 3: Economic Institutions144 Questions
Exam 4: Supply and Demand151 Questions
Exam 5: Using Supply and Demand136 Questions
Exam 6: Describing Supply and Demand: Elasticities176 Questions
Exam 7: Taxation and Government Intervention169 Questions
Exam 8: Market Failure Versus Government Failure160 Questions
Exam 9: Comparative Advantage, Exchange Rates, and Globalization107 Questions
Exam 10: International Trade Policy82 Questions
Exam 11: Production and Cost Analysis I160 Questions
Exam 12: Production and Cost Analysis II129 Questions
Exam 13: Perfect Competition137 Questions
Exam 14: Monopoly and Monopolistic Competition231 Questions
Exam 15: Oligopoly and Antitrust Policy111 Questions
Exam 16: Real-World Competition and Technology86 Questions
Exam 17: Work and the Labor Market130 Questions
Exam 18: Who Gets What the Distribution of Income100 Questions
Exam 19: The Logic of Individual Choice: the Foundation of Supply and Demand134 Questions
Exam 20: Game Theory, Strategic Decision Making, and Behavioral Economics76 Questions
Exam 21: Thinking Like a Modern Economist67 Questions
Exam 22: Behavioral Economics and Modern Economic Policy87 Questions
Exam 23: Microeconomic Policy, Economic Reasoning, and Beyond111 Questions
Select questions type
When output is 20, fixed costs are $100 and variable costs are $400. When output rises to 21, fixed costs are $100 and variable costs are $450. This implies that the marginal cost of the last unit of output equals:
Free
(Multiple Choice)
4.8/5  (42)
(42)
Correct Answer: Verified
B
Refer to the following graph. 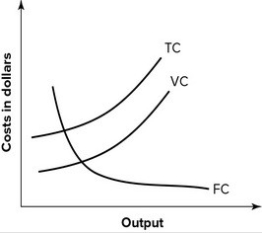 This set of cost curves is:
Free
(Multiple Choice)
4.8/5 (43)
Correct Answer:Verified
C
Refer to the graph shown. 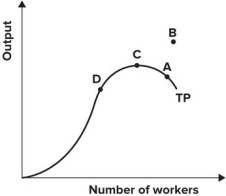 Marginal product is negative at point:
Free
(Multiple Choice)
4.9/5 (38)
Correct Answer:Verified
A
Refer to the graph shown. Within which part of the production function is the firm most likely to operate? 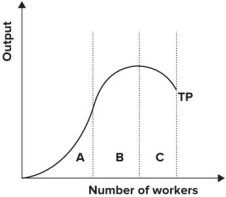
(Multiple Choice)
4.8/5 (42)
Refer to the table shown. The average fixed cost of producing 5 units of output is: Units of output Total cost 0 5 1 11 2 16 3 20 4 23 5 25 6 26
(Multiple Choice)
4.8/5 (39)
What kind of costs remain the same regardless of the level of production?
(Multiple Choice)
4.8/5 (32)
Refer to the table shown. The average variable cost of producing five bicycles per week is: Output (bicycles per week) Total cast (dollars) 1 100 2 200 3 310 4 440 5 580 6 730 7 900 8 1,200
(Multiple Choice)
4.9/5 (32)
The vertical distance between the average total cost and average variable cost curves falls as output rises.
(True/False)
4.9/5 (28)
The following graph shows average fixed costs, average variable costs, average total costs, and marginal costs of production.  Average variable cost is minimized when output equals:
(Multiple Choice)
4.8/5 (35)
If the law of diminishing marginal productivity holds true, eventually both the marginal cost curve and the average cost curve must become:
(Multiple Choice)
4.9/5 (32)
When output is 500, a firm's fixed costs are $10,000 and its variable costs are $15,000. The firm's total costs are therefore:
(Multiple Choice)
4.8/5 (35)
The law of diminishing marginal productivity states that as more units of a variable input are added, holding other inputs constant (ceteris paribus), the additional output obtained from each new unit of the variable input eventually falls.
(True/False)
4.8/5 (41)
If your latest test grade and your average test grade on previous exams are equal, your average test grade will:
(Multiple Choice)
4.7/5 (33)
The following graph shows average fixed costs, average variable costs, average total costs, and marginal costs of production. 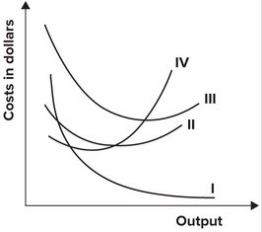 In the graph shown, the marginal cost curve is represented by which curve?
(Multiple Choice)
4.7/5 (45)
The relationship between the quantity of inputs and the quantity of output is called the:
(Multiple Choice)
4.9/5 (36)
Refer to the table shown. If the number of workers is three, total output is: Number of workers Mar ginal product of workers 1 2 2 5 3 9 4 14 5 16 6 17 7 18 8 18 9 17 10 15
(Multiple Choice)
4.8/5 (37)
Filters
- Essay(0)
- Multiple Choice(0)
- Short Answer(0)
- True False(0)
- Matching(0)