Exam 4: Supply and Demand: Applications and Extensions
Exam 1: The Economic Approach164 Questions
Exam 2: Some Tools of the Economist200 Questions
Exam 3: Demand, Supply, and the Market Process336 Questions
Exam 4: Supply and Demand: Applications and Extensions254 Questions
Exam 5: Difficult Cases for the Market, and the Role of Government130 Questions
Exam 6: The Economics of Political Action154 Questions
Exam 7: Taking the Nations Economic Pulse214 Questions
Exam 8: Economic Fluctuations, Unemployment, and Inflation174 Questions
Exam 9: An Introduction to Basic Macroeconomic Markets219 Questions
Exam 10: Dynamic Change, Economic Fluctuations, and the Ad-As Model189 Questions
Exam 11: Fiscal Policy: the Keynesian View and the Historical Development of Macroeconomics109 Questions
Exam 12: Fiscal Policy, Incentives, and Secondary Effects146 Questions
Exam 13: Money and the Banking System209 Questions
Exam 14: Modern Macroeconomics and Monetary Policy192 Questions
Exam 15: Stabilization Policy, Output, and Employment148 Questions
Exam 16: Creating an Environment for Growth and Prosperity120 Questions
Exam 17: Institutions, Policies, and Cross-Country Differences in Income and Growth111 Questions
Exam 18: Gaining From International Trade170 Questions
Exam 19: International Finance and the Foreign Exchange Market148 Questions
Select questions type
In 2010 the federal government reduced the Social Security tax withholding rate from 12.4 percent (6.2 percent on both the employer and employee) to 8.4 percent (4.2 percent on both the employer and employee) on the wages of all workers. If the tax were redefined such that the entire 12.4 percent was statutorily levied on employers, economic analysis suggests that the actual burden of the tax would
(Multiple Choice)
4.8/5  (38)
(38)
Use the figure below to answer the following question(s).
Figure 4-4 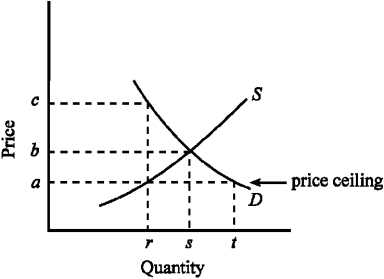 -Given the demand and supply conditions shown in Figure 4-4, if the government imposes a price ceiling of a, which of the following would be true?
(Multiple Choice)
4.9/5 (39)
Figure 4-15  -In Figure 4-15, suppose a price floor is established at $20.00. What is the result?
(Multiple Choice)
5.0/5 (48)
The City of Greenville needs to raise revenue. Alderman Black has proposed a $10 tax on red cars in the city, currently numbering 2,000. Mayor White, who wants more than $20,000 in revenue, proposes taxing these cars at $100 each. Councilwoman Bluestone goes even farther, suggesting a $1,000 per red car tax, arguing that her proposal will raise $2 million. If maximizing tax revenue is the only consideration, which proposal should pass? Why?
(Essay)
4.8/5 (41)
Figure 4-19 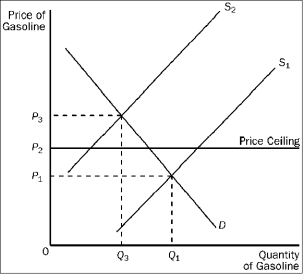 -Refer to Figure 4-19. When the price ceiling applies in this market and the supply curve for gasoline shifts from S1 to S2,
(Multiple Choice)
4.7/5 (36)
Use the figure below to answer the following question(s).
Figure 4-13 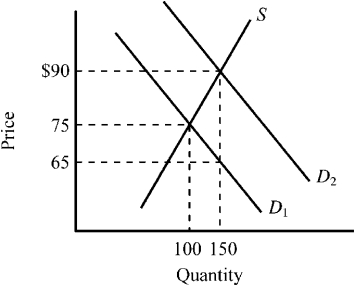 -Refer to Figure 4-13. The exhibit illustrates the impact of granting a subsidy on a particular good. Which of the following is true for this subsidy given the information provided in the exhibit?
(Multiple Choice)
4.9/5 (36)
Lowincomesville is a poor town. The mayor has decided to impose a law to cut all rental rates on apartments in half and to fix them at this level. Will this help the poor? Why or why not? Be sure to distinguish between the short run and the long run.
(Essay)
4.9/5 (34)
Emma works full time during the day as an economist and faces a 90 percent marginal tax rate. If Emma were to get an offer to work a second job in the evenings doing consulting work for a local business for $10,000 per year, how much of this additional income would she be able to keep as net pay after taxes?
(Multiple Choice)
4.8/5 (34)
Figure 4-24 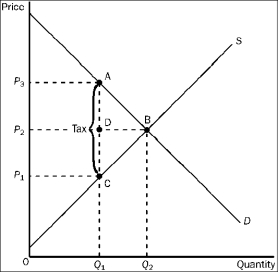 -Refer to Figure 4-24. The per-unit burden of the tax on sellers is
(Multiple Choice)
4.9/5 (36)
Figure 4-21 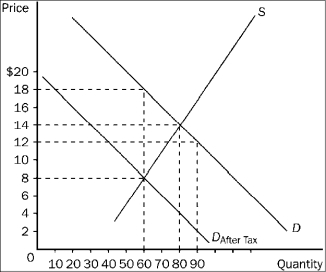 -Refer to Figure 4-21. The price paid by buyers after the tax is imposed is
(Multiple Choice)
4.9/5 (38)
When a government subsidy is granted to the sellers of a product, buyers can end up capturing some of the benefit because
(Multiple Choice)
4.9/5 (40)
A market that operates outside the legal system, either by selling illegal goods or by selling goods at illegal prices is referred to in economics as a
(Multiple Choice)
4.8/5 (39)
Figure 4-20  -Refer to Figure 4-20. Suppose the same S and D curves apply, and a tax of the same amount per unit as shown here is imposed. Now, however, the sellers of the good, rather than the buyers, are required to pay the tax to the government. Now, relative to the case depicted in the figure,
(Multiple Choice)
4.8/5 (35)
If Jayla's tax liability increases from $10,000 to $16,000 when her income increases from $30,000 to $40,000, her marginal tax rate is
(Multiple Choice)
4.9/5 (38)
Suppose that the minimum wage was increased to $10 per hour. Which of the following would be most likely to result from the minimum wage increase?
(Multiple Choice)
4.8/5 (29)
Which of the following is the most likely outcome of minimum wage laws?
(Multiple Choice)
4.8/5 (35)
If the government wants to raise tax revenue and shift most of the tax burden to the consumers, it would impose a tax on a good with a
(Multiple Choice)
4.9/5 (34)
Filters
- Essay(0)
- Multiple Choice(0)
- Short Answer(0)
- True False(0)
- Matching(0)