Exam 4: Supply and Demand: Applications and Extensions
Exam 1: The Economic Approach164 Questions
Exam 2: Some Tools of the Economist200 Questions
Exam 3: Demand, Supply, and the Market Process336 Questions
Exam 4: Supply and Demand: Applications and Extensions254 Questions
Exam 5: Difficult Cases for the Market, and the Role of Government130 Questions
Exam 6: The Economics of Political Action154 Questions
Exam 7: Taking the Nations Economic Pulse214 Questions
Exam 8: Economic Fluctuations, Unemployment, and Inflation174 Questions
Exam 9: An Introduction to Basic Macroeconomic Markets219 Questions
Exam 10: Dynamic Change, Economic Fluctuations, and the Ad-As Model189 Questions
Exam 11: Fiscal Policy: the Keynesian View and the Historical Development of Macroeconomics109 Questions
Exam 12: Fiscal Policy, Incentives, and Secondary Effects146 Questions
Exam 13: Money and the Banking System209 Questions
Exam 14: Modern Macroeconomics and Monetary Policy192 Questions
Exam 15: Stabilization Policy, Output, and Employment148 Questions
Exam 16: Creating an Environment for Growth and Prosperity120 Questions
Exam 17: Institutions, Policies, and Cross-Country Differences in Income and Growth111 Questions
Exam 18: Gaining From International Trade170 Questions
Exam 19: International Finance and the Foreign Exchange Market148 Questions
Select questions type
Figure 4-18 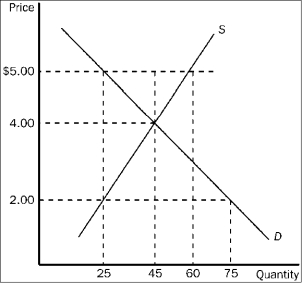 -Refer to Figure 4-18. If the government imposes a price ceiling of $2.00 in this market, the result is a
(Multiple Choice)
4.9/5  (34)
(34)
The more inelastic the demand for a product, the more likely that the actual benefit of a subsidy granted on the product will
(Multiple Choice)
4.8/5 (33)
Use the figure below to answer the following question(s).
Figure 4-12 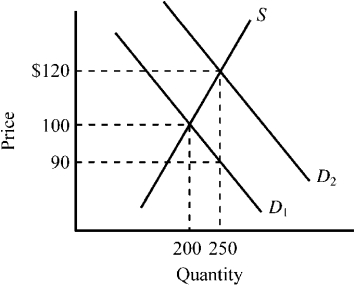 -Refer to Figure 4-12. The supply curve S and the demand curve D1 indicate initial conditions in the market for college textbooks. A new government program is implemented that grants students a $30 per textbook subsidy on every textbook they purchase, shifting the demand curve from D1 to D2. Which of the following is true for this subsidy given the information provided in the exhibit?
(Multiple Choice)
4.8/5 (40)
A tax for which the average tax rate rises with income is defined as a
(Multiple Choice)
5.0/5 (37)
The excess burden or deadweight loss of a tax refers to the
(Multiple Choice)
4.9/5 (33)
When the top marginal tax rates were lowered substantially during the 1980s, the inflation-adjusted income tax revenue collected from the top 1 percent of all income earners
(Multiple Choice)
4.8/5 (43)
Which of the following is a major disadvantage of setting the price of a good below equilibrium and using waiting in line rather than price to ration the good?
(Multiple Choice)
4.7/5 (38)
Figure 4-22 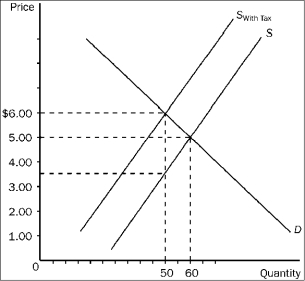 -Refer to Figure 4-22. The amount of the tax per unit is
(Multiple Choice)
4.9/5 (40)
Figure 4-16 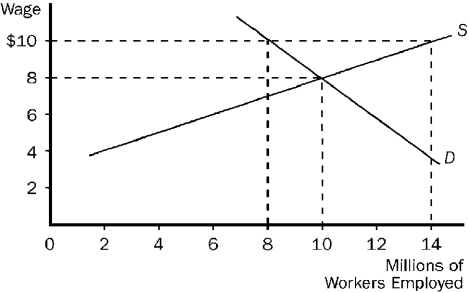 -Refer to Figure 4-16. Some policymakers have argued that the government should establish a "living wage." A living wage would provide workers a reasonable standard of living in their city or region. If a living wage of $10 per hour is established in the market pictured here, we would expect
(Multiple Choice)
4.9/5 (34)
The term "deadweight loss" or "excess burden" is used to describe the
(Multiple Choice)
4.8/5 (41)
A legal system that provides secure private property rights and unbiased enforcement of contracts
(Multiple Choice)
4.9/5 (38)
Figure 4-20 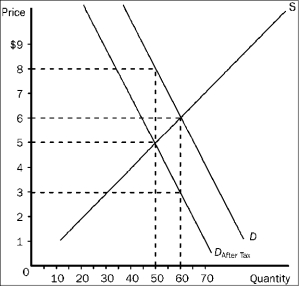 -Refer to Figure 4-20. The amount of the tax per unit is
(Multiple Choice)
4.8/5 (32)
If a $50 subsidy is legally (statutorily) granted to the sellers of weed eaters and as a result the price of weed eaters to consumers falls by $30, the actual benefit of the subsidy
(Multiple Choice)
4.8/5 (38)
Suppose the market equilibrium price of corn is $5 per bushel, and the government sets a price ceiling of $4 per bushel. What is the most likely result of this action?
(Multiple Choice)
4.9/5 (34)
Government programs such as Medicare substantially subsidize health care purchases by some consumers in the U.S. economy. Who benefits from these subsidies? How do they affect the price of health care? If you are not a recipient of this program, are you made better or worse off by the subsidy? Explain.
(Essay)
5.0/5 (33)
Use the figure below to answer the following question(s).
Figure 4-4 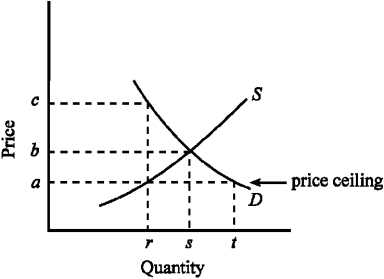 -Given the demand and supply conditions shown in Figure 4-4, what will happen as the result of imposing a price ceiling of a?
(Multiple Choice)
4.8/5 (36)
Use the figure below to answer the following question(s).
Figure 4-8 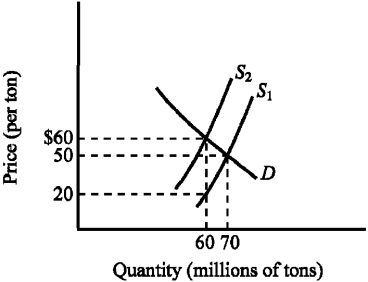 -Refer to Figure 4-8. The supply curve S1 and the demand curve D indicate initial conditions in the market for soft coal. A $40-per-ton tax on soft coal is levied, shifting the supply curve from S1 to S2. Imposing the tax increases the equilibrium price of soft coal from
(Multiple Choice)
4.9/5 (39)
Filters
- Essay(0)
- Multiple Choice(0)
- Short Answer(0)
- True False(0)
- Matching(0)