Exam 2: Organizing and Graphing Data
Exam 1: Introduction50 Questions
Exam 2: Organizing and Graphing Data93 Questions
Exam 3: Numerical Descriptive Measures92 Questions
Exam 4: Probability75 Questions
Exam 5: Discrete Random Variables and Their Probability Distribution77 Questions
Exam 6: Continuous Random Variables and the Normal Distribution74 Questions
Exam 7: Sampling Distributions76 Questions
Exam 8: Estimation of the Mean and Proportion60 Questions
Exam 9: Hypothesis Tests About the Mean and Proportion93 Questions
Exam 10: Estimation and Hypothesis Testing: Two Populations45 Questions
Exam 11: Chi-Square Tests98 Questions
Exam 12: Analysis of Variance62 Questions
Exam 13: Simple Linear Regression105 Questions
Select questions type
Use the following to answer questions :
The following table gives the cumulative frequency distribution of annual incomes (in thousands of dollars)for a sample of 200 families selected from a city.
 -The number of families with an income of $40,000 or less is:
(Short Answer)
4.8/5  (37)
(37)
The procedure for obtaining the percentage for a class is to:
(Multiple Choice)
4.8/5 (32)
Use the following to answer questions :
The following table gives the frequency distribution of the number of rooms for a sample of 100 houses.
 -The number of classes for this frequency distribution table is:
(Short Answer)
4.8/5 (39)
Use the following to answer questions :
A highway patrolman records the following speeds (in mph)for 25 cars that pass through his radar within a five-minute interval.Here is the histogram of that data: 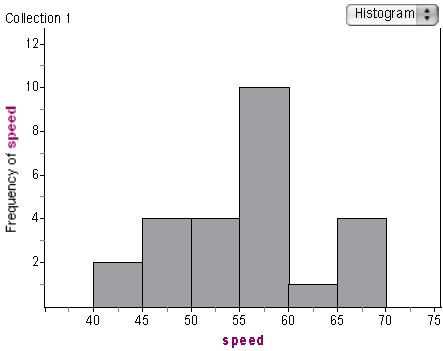 -The speed limit on this street is 60 mph.What percentage of drivers are traveling at or above the speed limit?
(Short Answer)
4.8/5 (35)
Use the following to answer questions :
The following table gives the cumulative frequency distribution of the commuting time (in minutes)from home to work for a sample of 400 persons selected from a city.
 -In a game of four-handed Hearts,all 52 cards of a standard deck are dealt,so that each player starts each round with 13 cards in a hand.Suppose player A's hand has three clubs,six diamonds,two hearts,and two spades.What is the relative frequency of spades,rounded to two decimal places,dealt to player A?
(Short Answer)
4.8/5 (45)
The maximum number of goals scored by a national team in the last 14 FIFA's World Cups is shown below.Select the bar graph that matches with the data.
14 15 15 16 16 17 23
18 15 14 15 19 14 27
I 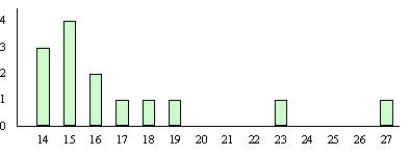 II
II 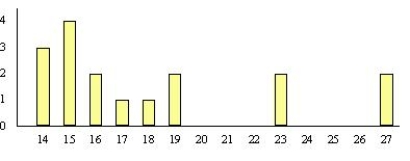
(Short Answer)
4.7/5 (41)
Use the following to answer questions :
Here is a dot plot of the daily high temperature (in Fahrenheit)from a sample of 25 U.S.cities: 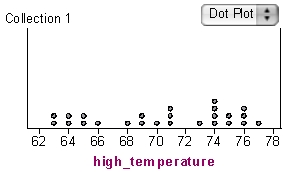 -What is the relative frequency of high temperatures,rounded to two decimal places,that are 71 degrees or lower?
(Short Answer)
4.7/5 (37)
Use the following to answer questions :
The following table gives the cumulative frequency distribution of the commuting time (in minutes)from home to work for a sample of 400 persons selected from a city.
-The sample size is:
(Short Answer)
4.9/5 (35)
Use the following to answer questions :
The following table gives the cumulative frequency distribution of the commuting time (in minutes)from home to work for a sample of 400 persons selected from a city.
-The percentage of persons who commute for less than 50 minutes,rounded to two decimal places,is:
(Short Answer)
4.7/5 (37)
Use the following to answer questions :
A highway patrolman records the following speeds (in mph)for 25 cars that pass through his radar within a five-minute interval.Here is the histogram of that data:
-How many observations fall in the fourth interval?
(Short Answer)
4.9/5 (36)
Use the following to answer questions :
The following table gives the frequency distribution of the number of telephones owned by a sample of 50 households selected from a city.
 -The relative frequency of the second class,rounded to two decimal places,is:
(Short Answer)
4.8/5 (37)
Use the following to answer questions :
The following table gives the frequency distribution of opinions of 50 persons in regard to an issue.
 -The relative frequency,expressed to two decimal places,of the "Against" category is:
(Short Answer)
4.8/5 (32)
Use the following to answer questions :
The following table gives the cumulative frequency distribution of annual incomes (in thousands of dollars)for a sample of 200 families selected from a city.
-The sample size is:
(Short Answer)
4.9/5 (40)
Use the following to answer questions :
The following table gives the cumulative frequency distribution of the commuting time (in minutes)from home to work for a sample of 400 persons selected from a city.
-For the observation 34,the leaf is:
(Short Answer)
4.9/5 (41)
Use the following to answer questions :
The following table gives the frequency distribution of rents paid per month by 500 families selected from a city.
 -The upper limit of the second class is:
(Short Answer)
4.7/5 (44)
The number of touchdowns of a college football team is:
38 36 30 33 37 30 35 34 43 27 36 38 21 26 26 27 31 22 28 36
a)Complete the frequency distribution.
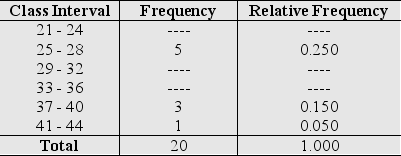 b)Select the bar graph that matches the data.
I
b)Select the bar graph that matches the data.
I 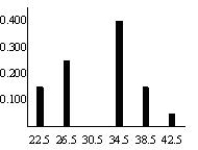 II
II 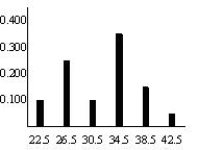 III
III 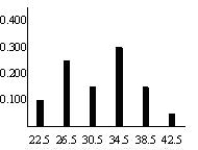
(Essay)
4.7/5 (43)
Use the following to answer questions :
The following table gives the frequency distribution of the number of rooms for a sample of 100 houses.
-The relative frequency of the fifth class,rounded to two decimal places,is:
(Short Answer)
4.9/5 (32)
Filters
- Essay(0)
- Multiple Choice(0)
- Short Answer(0)
- True False(0)
- Matching(0)