Exam 2: Organizing and Graphing Data
Exam 1: Introduction50 Questions
Exam 2: Organizing and Graphing Data93 Questions
Exam 3: Numerical Descriptive Measures92 Questions
Exam 4: Probability75 Questions
Exam 5: Discrete Random Variables and Their Probability Distribution77 Questions
Exam 6: Continuous Random Variables and the Normal Distribution74 Questions
Exam 7: Sampling Distributions76 Questions
Exam 8: Estimation of the Mean and Proportion60 Questions
Exam 9: Hypothesis Tests About the Mean and Proportion93 Questions
Exam 10: Estimation and Hypothesis Testing: Two Populations45 Questions
Exam 11: Chi-Square Tests98 Questions
Exam 12: Analysis of Variance62 Questions
Exam 13: Simple Linear Regression105 Questions
Select questions type
Use the following to answer questions :
The following table gives the frequency distribution of test scores for a math class of 30 students.
 -The lower limit of the fourth class is:
(Short Answer)
4.9/5  (34)
(34)
Use the following to answer questions :
The following table gives the frequency distribution of the number of rooms for a sample of 100 houses.
 -The percentage of houses that contain five or more rooms is:
(Short Answer)
4.8/5 (34)
Use the following to answer questions :
The following table gives the frequency distribution of the number of rooms for a sample of 100 houses.
-The percentage of houses that have three or fewer rooms is:
(Short Answer)
4.9/5 (33)
Use the following to answer questions :
The following table gives the frequency distribution of test scores for a math class of 30 students.
-The upper limit of the fourth class is:
(Short Answer)
4.8/5 (30)
Use the following to answer questions :
Here is a dot plot of the daily high temperature (in Fahrenheit)from a sample of 25 U.S.cities: 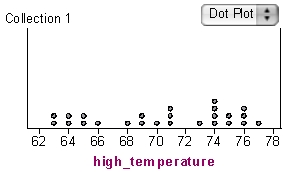 -What percentage of cities had a high temperature of more than 74 degrees?
(Short Answer)
4.9/5 (35)
Use the following to answer questions :
The following table gives the frequency distribution of opinions of 50 persons in regard to an issue.
 -The percentage of persons who are either in favor of this issue or have no opinion is:
(Short Answer)
4.7/5 (40)
Use the following to answer questions :
The following table gives the cumulative frequency distribution of the commuting time (in minutes)from home to work for a sample of 400 persons selected from a city.
 -The percentage of persons who commute for 40 or more minutes,rounded to two decimal places,is:
(Short Answer)
4.8/5 (39)
The procedure for obtaining the relative frequency of a class is to:
(Multiple Choice)
4.9/5 (38)
The following table shows the countries whose teams have won the UEFA Champions League.
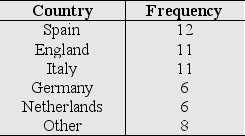 a)Calculate the relative frequency of each country.Round your answers to three decimal places
b)Select the pie chart that better describes the data.
I
a)Calculate the relative frequency of each country.Round your answers to three decimal places
b)Select the pie chart that better describes the data.
I 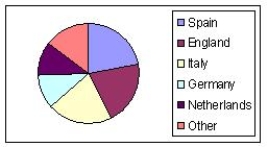 II
II 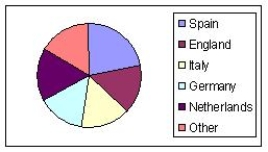 III
III 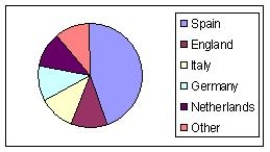
(Essay)
4.9/5 (33)
Use the following to answer questions :
The following table gives the frequency distribution of test scores for a math class of 30 students.
-The midpoint of the fourth class is:
(Short Answer)
4.8/5 (37)
Use the following to answer questions :
The following table gives the frequency distribution of the number of telephones owned by a sample of 50 households selected from a city.
 -The number of households which own more than one telephone is:
(Short Answer)
4.9/5 (39)
Use the following to answer questions :
The following table gives the cumulative frequency distribution of the commuting time (in minutes)from home to work for a sample of 400 persons selected from a city.
-The number of persons who commute for 20 or more minutes is:
(Short Answer)
4.7/5 (33)
In 2007/2008 basketball season,Steve Nash scored 485 field goals,179 3-point field goals,and 222 free-throw goals.Find the pie chart that better describes the data.
(Multiple Choice)
4.9/5 (32)
Use the following to answer questions :
The following table gives the frequency distribution of test scores for a math class of 30 students.
-The sample size is:
(Short Answer)
4.8/5 (27)
Use the following to answer questions :
Suppose you have the following stem-and-leaf display:  Stem: Tens Leaf: Ones
-How many observations are in this data set?
Stem: Tens Leaf: Ones
-How many observations are in this data set?
(Short Answer)
4.8/5 (41)
Use the following to answer questions :
The following table gives the frequency distribution of the highest degrees held by 25 professionals.
 -The percentage of persons who hold a Doctorate is:
(Short Answer)
4.9/5 (26)
Use the following to answer questions :
The following table gives the frequency distribution of the highest degrees held by 25 professionals.
-The percentage of persons with a Bachelor's degree as the highest degree is:
(Short Answer)
5.0/5 (44)
Filters
- Essay(0)
- Multiple Choice(0)
- Short Answer(0)
- True False(0)
- Matching(0)