Exam 9: Comparative Advantage and the Gains From International Trade
Exam 1: Economics: Foundations and Models459 Questions
Exam 2: Trade-Offs, Comparative Advantage, and the Market System492 Questions
Exam 3: Where Prices Come From: the Interaction of Demand and Supply476 Questions
Exam 4: Economic Efficiency, Government Price Setting, and Taxes420 Questions
Exam 5: Externalities, Environmental Policy, and Public Goods262 Questions
Exam 6: Elasticity: the Responsiveness of Demand and Supply293 Questions
Exam 7: The Economics of Health Care337 Questions
Exam 8: Firms, the Stock Market, and Corporate Governance512 Questions
Exam 9: Comparative Advantage and the Gains From International Trade377 Questions
Exam 10: Consumer Choice and Behavioral Economics304 Questions
Exam 11: Technology, Production, and Costs326 Questions
Exam 12: Firms in Perfectly Competitive Markets296 Questions
Exam 13: Monopolistic Competition: the Competitive Model in a More Realistic Setting272 Questions
Exam 14: Oligopoly: Firms in Less Competitive Markets256 Questions
Exam 15: Monopoly and Antitrust Policy279 Questions
Exam 16: Pricing Strategy258 Questions
Exam 17: The Markets for Labor and Other Factors of Production279 Questions
Exam 18: Public Choice, Taxes, and the Distribution of Income258 Questions
Exam 19: Gdp: Measuring Total Production and Income260 Questions
Exam 20: Unemployment and Inflation290 Questions
Exam 21: Economic Growth, the Financial System, and Business Cycles251 Questions
Exam 22: Long-Run Economic Growth: Sources and Policies261 Questions
Exam 23: Aggregate Expenditure and Output in the Short Run305 Questions
Exam 24: Aggregate Demand and Aggregate Supply Analysis286 Questions
Exam 25: Money, Banks, and the Federal Reserve System278 Questions
Exam 26: Monetary Policy280 Questions
Exam 27: Fiscal Policy313 Questions
Exam 28: Inflation, Unemployment, and Federal Reserve Policy257 Questions
Exam 29: Macroeconomics in an Open Economy277 Questions
Exam 30: The International Financial System258 Questions
Select questions type
Figure 9-1 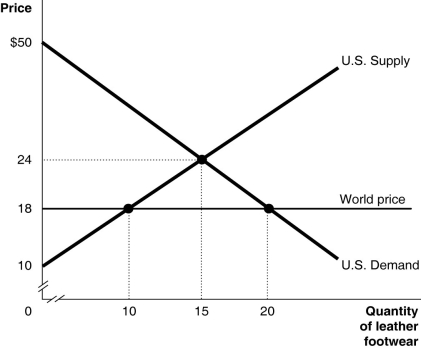 Figure 9-1 shows the U.S. demand and supply for leather footwear.
-Refer to Figure 9-1. Suppose the government allows imports of leather footwear into the United States. What will the market price be?
Figure 9-1 shows the U.S. demand and supply for leather footwear.
-Refer to Figure 9-1. Suppose the government allows imports of leather footwear into the United States. What will the market price be?
(Multiple Choice)
4.8/5  (33)
(33)
When BMW, an German company, purchases a welding machine that was made in Toronto, the purchase is
(Multiple Choice)
4.7/5 (38)
As a percentage of GDP, exports are greater than imports for which of the following countries?
(Multiple Choice)
4.8/5 (31)
Figure 9-3 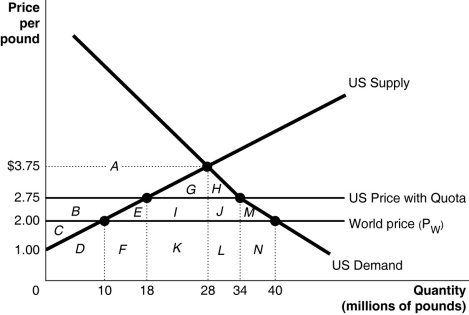 Since 1953 the United States has imposed a quota to limit the imports of peanuts. Figure 9-3 illustrates the impact of the quota.
-Refer to Figure 9-3. What is the area of domestic producer surplus after the imposition of a quota?
Since 1953 the United States has imposed a quota to limit the imports of peanuts. Figure 9-3 illustrates the impact of the quota.
-Refer to Figure 9-3. What is the area of domestic producer surplus after the imposition of a quota?
(Multiple Choice)
4.8/5 (39)
A tax imposed by a government on imports of a good into a country is called a
(Multiple Choice)
4.9/5 (35)
Figure 9-6 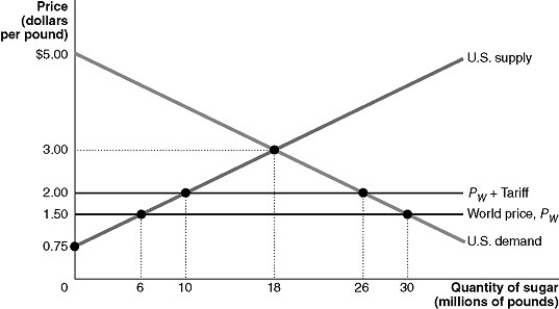 Suppose the U.S. government imposes a $0.50 per pound tariff on sugar imports. Figure 9-6 shows the demand and supply curves for sugar and the impact of this tariff.
-Use Figure 9-6 to answer questions a-i.
a. Following the imposition of the tariff, what is the price that domestic consumers must now pay and what is the quantity purchased?
b. Calculate the value of consumer surplus with the tariff in place.
c. What is the quantity supplied by domestic sugar producers with the tariff in place?
d. Calculate the value of producer surplus received by U.S. sugar producers with the tariff in place.
e. What is the quantity of sugar imported with the tariff in place?
f. What is the amount of tariff revenue collected by the government?
g. The tariff has reduced consumer surplus. Calculate the loss in consumer surplus due to the tariff.
h. What portion of the consumer surplus loss is redistributed to domestic producers? To the government?
i. Calculate the deadweight loss due to the tariff.
Suppose the U.S. government imposes a $0.50 per pound tariff on sugar imports. Figure 9-6 shows the demand and supply curves for sugar and the impact of this tariff.
-Use Figure 9-6 to answer questions a-i.
a. Following the imposition of the tariff, what is the price that domestic consumers must now pay and what is the quantity purchased?
b. Calculate the value of consumer surplus with the tariff in place.
c. What is the quantity supplied by domestic sugar producers with the tariff in place?
d. Calculate the value of producer surplus received by U.S. sugar producers with the tariff in place.
e. What is the quantity of sugar imported with the tariff in place?
f. What is the amount of tariff revenue collected by the government?
g. The tariff has reduced consumer surplus. Calculate the loss in consumer surplus due to the tariff.
h. What portion of the consumer surplus loss is redistributed to domestic producers? To the government?
i. Calculate the deadweight loss due to the tariff.
(Essay)
4.7/5 (33)
Figure 9-2 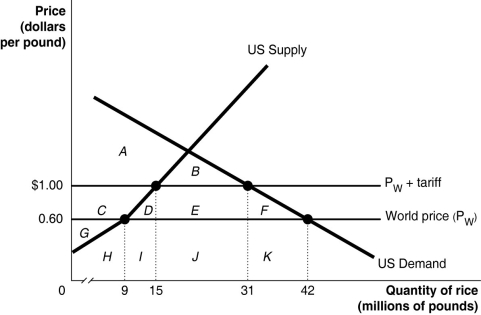 Suppose the U.S. government imposes a $0.40 per pound tariff on rice imports. Figure 9-2 shows the impact of this tariff.
-Refer to Figure 9-2. With the tariff in place, the United States consumes
Suppose the U.S. government imposes a $0.40 per pound tariff on rice imports. Figure 9-2 shows the impact of this tariff.
-Refer to Figure 9-2. With the tariff in place, the United States consumes
(Multiple Choice)
4.9/5 (32)
Suppose that American firms claim that protectionism in Canada is on the rise as the Canadian government attempts to protect its infant industries. This protectionism will cause the greatest harm to
(Multiple Choice)
4.7/5 (40)
Measuring the impact of a quota or tariff on the U.S. economy is an example of ________. Stating that a quota or tariff should be eliminated is an example of ________.
(Multiple Choice)
4.8/5 (33)
________ is the ability to produce more of a good or service than competitors when using the same amount of resources.
(Multiple Choice)
4.9/5 (35)
What does it mean for a country to have an absolute advantage in producing a product?
(Essay)
4.8/5 (33)
Assume that China has a comparative advantage in producing corn and exports corn to Japan. We can conclude that
(Multiple Choice)
4.7/5 (50)
Figure 9-3 Since 1953 the United States has imposed a quota to limit the imports of peanuts. Figure 9-3 illustrates the impact of the quota.
-Refer to Figure 9-3. Without the quota, the domestic price of peanuts equals the world price which is $2.00 per pound. What is the quantity of peanuts supplied by domestic producers in the absence of a quota?
(Multiple Choice)
4.8/5 (33)
Table 9-12
Output per hour Production and Production
of work Consumption without Trade with Trade
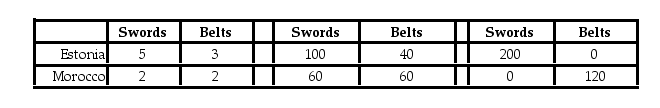 Estonia and Morocco can produce both swords and belts. Each country has a total of 40 available labor hours for the production of swords and belts. Table 9-12 shows the output per hour of work, the production and consumption quantities without trade, and the production numbers with trade.
-Refer to Table 9-12. If the actual terms of trade are 1 belt for 1.5 swords and 50 belts are traded, how many belts will Estonia consume?
Estonia and Morocco can produce both swords and belts. Each country has a total of 40 available labor hours for the production of swords and belts. Table 9-12 shows the output per hour of work, the production and consumption quantities without trade, and the production numbers with trade.
-Refer to Table 9-12. If the actual terms of trade are 1 belt for 1.5 swords and 50 belts are traded, how many belts will Estonia consume?
(Multiple Choice)
4.9/5 (37)
Domestically produced goods and services sold to other countries are referred to as
(Multiple Choice)
4.9/5 (36)
Filters
- Essay(0)
- Multiple Choice(0)
- Short Answer(0)
- True False(0)
- Matching(0)