Exam 9: Comparative Advantage and the Gains From International Trade
Exam 1: Economics: Foundations and Models459 Questions
Exam 2: Trade-Offs, Comparative Advantage, and the Market System492 Questions
Exam 3: Where Prices Come From: the Interaction of Demand and Supply476 Questions
Exam 4: Economic Efficiency, Government Price Setting, and Taxes420 Questions
Exam 5: Externalities, Environmental Policy, and Public Goods262 Questions
Exam 6: Elasticity: the Responsiveness of Demand and Supply293 Questions
Exam 7: The Economics of Health Care337 Questions
Exam 8: Firms, the Stock Market, and Corporate Governance512 Questions
Exam 9: Comparative Advantage and the Gains From International Trade377 Questions
Exam 10: Consumer Choice and Behavioral Economics304 Questions
Exam 11: Technology, Production, and Costs326 Questions
Exam 12: Firms in Perfectly Competitive Markets296 Questions
Exam 13: Monopolistic Competition: the Competitive Model in a More Realistic Setting272 Questions
Exam 14: Oligopoly: Firms in Less Competitive Markets256 Questions
Exam 15: Monopoly and Antitrust Policy279 Questions
Exam 16: Pricing Strategy258 Questions
Exam 17: The Markets for Labor and Other Factors of Production279 Questions
Exam 18: Public Choice, Taxes, and the Distribution of Income258 Questions
Exam 19: Gdp: Measuring Total Production and Income260 Questions
Exam 20: Unemployment and Inflation290 Questions
Exam 21: Economic Growth, the Financial System, and Business Cycles251 Questions
Exam 22: Long-Run Economic Growth: Sources and Policies261 Questions
Exam 23: Aggregate Expenditure and Output in the Short Run305 Questions
Exam 24: Aggregate Demand and Aggregate Supply Analysis286 Questions
Exam 25: Money, Banks, and the Federal Reserve System278 Questions
Exam 26: Monetary Policy280 Questions
Exam 27: Fiscal Policy313 Questions
Exam 28: Inflation, Unemployment, and Federal Reserve Policy257 Questions
Exam 29: Macroeconomics in an Open Economy277 Questions
Exam 30: The International Financial System258 Questions
Select questions type
Figure 9-4 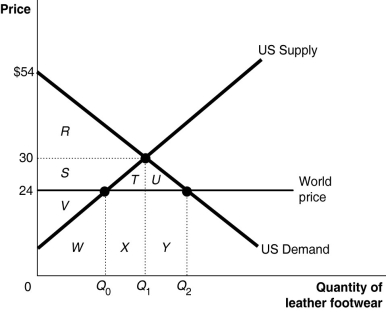 Figure 9-4 shows the U.S. demand and supply for leather footwear.
-Refer to Figure 9-4. Suppose the government allows imports of leather footwear into the United States. The market price falls to $24. What area represents domestic producer surplus?
Figure 9-4 shows the U.S. demand and supply for leather footwear.
-Refer to Figure 9-4. Suppose the government allows imports of leather footwear into the United States. The market price falls to $24. What area represents domestic producer surplus?
(Multiple Choice)
4.9/5  (27)
(27)
If Canada imports fishing poles from Mexico and Mexico imports bacon from Canada, which of the following would explain this pattern of trade?
(Multiple Choice)
4.8/5 (39)
Figure 9-1 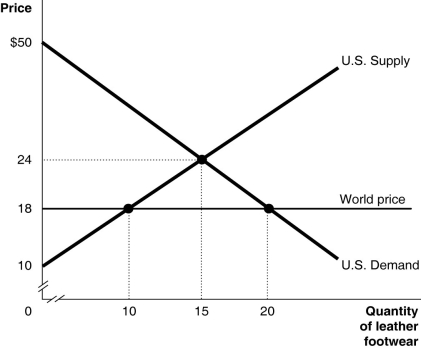 Figure 9-1 shows the U.S. demand and supply for leather footwear.
-Refer to Figure 9-1. Suppose the government allows imports of leather footwear into the United States. What will be the domestic quantity supplied?
Figure 9-1 shows the U.S. demand and supply for leather footwear.
-Refer to Figure 9-1. Suppose the government allows imports of leather footwear into the United States. What will be the domestic quantity supplied?
(Multiple Choice)
4.7/5 (40)
Examples of comparative advantage often begin with two countries that each produce the same two goods. Each country is then shown to have a comparative advantage in producing the good it can produce at a lower opportunity cost, and specializes in the production of the good for which it has a comparative advantage. How do these examples prove that both nations are made better off as a result of trade than they would be without trade?
(Essay)
4.8/5 (38)
Economists believe the most persuasive argument for protectionism is to protect infant industries. But the argument has a drawback. What is this drawback?
(Multiple Choice)
4.8/5 (43)
The process of countries becoming more open to foreign trade and investment is known as
(Multiple Choice)
4.9/5 (41)
One of the main sources of comparative advantage is natural resources.
(True/False)
4.8/5 (35)
What does it mean for a country to have a comparative advantage in producing a product?
(Essay)
4.8/5 (41)
Table 9-11
Output per hour Production and Production
of work Consumption without Trade with Trade
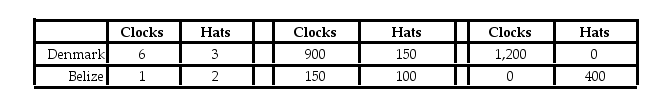 Denmark and Belize can produce both clocks and hats. Each country has a total of 200 available labor hours for the production of clocks and hats. Table 9-11 shows the output per hour of work, the production and consumption quantities without trade, and the production numbers with trade.
-Refer to Table 9-11. If the actual terms of trade are 1 hat for 1.8 clocks and 150 hats are traded, how many clocks will Denmark gain compared to the "without trade" numbers?
Denmark and Belize can produce both clocks and hats. Each country has a total of 200 available labor hours for the production of clocks and hats. Table 9-11 shows the output per hour of work, the production and consumption quantities without trade, and the production numbers with trade.
-Refer to Table 9-11. If the actual terms of trade are 1 hat for 1.8 clocks and 150 hats are traded, how many clocks will Denmark gain compared to the "without trade" numbers?
(Multiple Choice)
4.8/5 (38)
Table 9-11
Output per hour Production and Production
of work Consumption without Trade with Trade
Denmark and Belize can produce both clocks and hats. Each country has a total of 200 available labor hours for the production of clocks and hats. Table 9-11 shows the output per hour of work, the production and consumption quantities without trade, and the production numbers with trade.
-Refer to Table 9-11. What is the opportunity cost to produce 1 clock in Denmark?
(Multiple Choice)
4.9/5 (25)
Free trade ________ living standards by ________ economic efficiency.
(Multiple Choice)
4.9/5 (43)
Trade restrictions are often motivated by a desire to save domestic jobs threatened by competition from imports. Which of the following counter-arguments is made by economists who oppose trade restrictions?
(Multiple Choice)
5.0/5 (40)
In general, the costs tariffs and quotas impose on consumers are
(Multiple Choice)
4.9/5 (41)
Each year, the United States exports about 50 percent of its wheat crop.
(True/False)
4.9/5 (37)
Figure 9-2 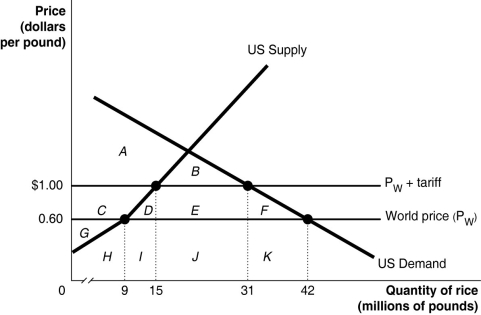 Suppose the U.S. government imposes a $0.40 per pound tariff on rice imports. Figure 9-2 shows the impact of this tariff.
-Refer to Figure 9-2. With the tariff in place, the United States produces
Suppose the U.S. government imposes a $0.40 per pound tariff on rice imports. Figure 9-2 shows the impact of this tariff.
-Refer to Figure 9-2. With the tariff in place, the United States produces
(Multiple Choice)
4.7/5 (33)
Goods and services bought domestically but produced in other countries are referred to as
(Multiple Choice)
4.9/5 (35)
Table 9-12
Output per hour Production and Production
of work Consumption without Trade with Trade
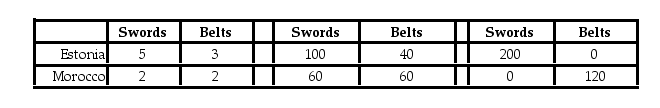 Estonia and Morocco can produce both swords and belts. Each country has a total of 40 available labor hours for the production of swords and belts. Table 9-12 shows the output per hour of work, the production and consumption quantities without trade, and the production numbers with trade.
-Refer to Table 9-12. If the actual terms of trade are 1 belt for 1.5 swords and 50 belts are traded, how many belts will Estonia gain compared to the "without trade" numbers?
Estonia and Morocco can produce both swords and belts. Each country has a total of 40 available labor hours for the production of swords and belts. Table 9-12 shows the output per hour of work, the production and consumption quantities without trade, and the production numbers with trade.
-Refer to Table 9-12. If the actual terms of trade are 1 belt for 1.5 swords and 50 belts are traded, how many belts will Estonia gain compared to the "without trade" numbers?
(Multiple Choice)
4.9/5 (40)
Filters
- Essay(0)
- Multiple Choice(0)
- Short Answer(0)
- True False(0)
- Matching(0)