Exam 9: Comparative Advantage and the Gains From International Trade
Exam 1: Economics: Foundations and Models459 Questions
Exam 2: Trade-Offs, Comparative Advantage, and the Market System492 Questions
Exam 3: Where Prices Come From: the Interaction of Demand and Supply476 Questions
Exam 4: Economic Efficiency, Government Price Setting, and Taxes420 Questions
Exam 5: Externalities, Environmental Policy, and Public Goods262 Questions
Exam 6: Elasticity: the Responsiveness of Demand and Supply293 Questions
Exam 7: The Economics of Health Care337 Questions
Exam 8: Firms, the Stock Market, and Corporate Governance512 Questions
Exam 9: Comparative Advantage and the Gains From International Trade377 Questions
Exam 10: Consumer Choice and Behavioral Economics304 Questions
Exam 11: Technology, Production, and Costs326 Questions
Exam 12: Firms in Perfectly Competitive Markets296 Questions
Exam 13: Monopolistic Competition: the Competitive Model in a More Realistic Setting272 Questions
Exam 14: Oligopoly: Firms in Less Competitive Markets256 Questions
Exam 15: Monopoly and Antitrust Policy279 Questions
Exam 16: Pricing Strategy258 Questions
Exam 17: The Markets for Labor and Other Factors of Production279 Questions
Exam 18: Public Choice, Taxes, and the Distribution of Income258 Questions
Exam 19: Gdp: Measuring Total Production and Income260 Questions
Exam 20: Unemployment and Inflation290 Questions
Exam 21: Economic Growth, the Financial System, and Business Cycles251 Questions
Exam 22: Long-Run Economic Growth: Sources and Policies261 Questions
Exam 23: Aggregate Expenditure and Output in the Short Run305 Questions
Exam 24: Aggregate Demand and Aggregate Supply Analysis286 Questions
Exam 25: Money, Banks, and the Federal Reserve System278 Questions
Exam 26: Monetary Policy280 Questions
Exam 27: Fiscal Policy313 Questions
Exam 28: Inflation, Unemployment, and Federal Reserve Policy257 Questions
Exam 29: Macroeconomics in an Open Economy277 Questions
Exam 30: The International Financial System258 Questions
Select questions type
Figure 9-2 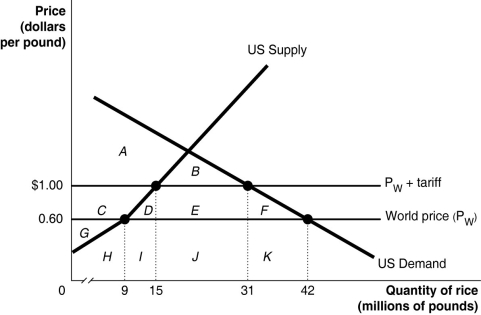 Suppose the U.S. government imposes a $0.40 per pound tariff on rice imports. Figure 9-2 shows the impact of this tariff.
-Refer to Figure 9-2. If the tariff was replaced by a quota which limited rice imports to 16 million pounds, the amount of additional revenue received by rice importers would equal
Suppose the U.S. government imposes a $0.40 per pound tariff on rice imports. Figure 9-2 shows the impact of this tariff.
-Refer to Figure 9-2. If the tariff was replaced by a quota which limited rice imports to 16 million pounds, the amount of additional revenue received by rice importers would equal
(Multiple Choice)
4.8/5  (45)
(45)
Figure 9-1 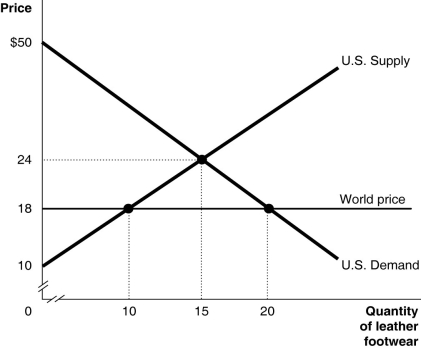 Figure 9-1 shows the U.S. demand and supply for leather footwear.
-Refer to Figure 9-1. Under autarky, the consumer surplus is
Figure 9-1 shows the U.S. demand and supply for leather footwear.
-Refer to Figure 9-1. Under autarky, the consumer surplus is
(Multiple Choice)
4.9/5 (36)
Economists studying the effect of the China shock on the U.S. economy point out that the firms most hurt by Chinese imports have been
(Multiple Choice)
4.7/5 (42)
Table 9-2
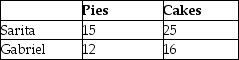 Sarita and Gabriel own S&G Bakery. Table 9-2 lists the number of pies and cakes Sarita and Gabriel can each bake in one day.
-Refer to Table 9-2. Select the statement that accurately interprets the data in the table.
Sarita and Gabriel own S&G Bakery. Table 9-2 lists the number of pies and cakes Sarita and Gabriel can each bake in one day.
-Refer to Table 9-2. Select the statement that accurately interprets the data in the table.
(Multiple Choice)
4.9/5 (41)
The United States has developed a comparative advantage in digital computers, airliners, and many prescription drugs. The source of its comparative advantage in these products is
(Multiple Choice)
5.0/5 (44)
Table 9-12
Output per hour Production and Production
of work Consumption without Trade with Trade
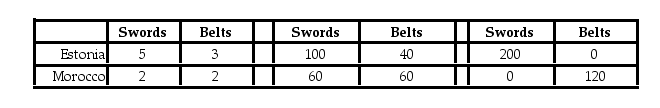 Estonia and Morocco can produce both swords and belts. Each country has a total of 40 available labor hours for the production of swords and belts. Table 9-12 shows the output per hour of work, the production and consumption quantities without trade, and the production numbers with trade.
-Refer to Table 9-12. What is the opportunity cost to produce 1 sword in Estonia?
Estonia and Morocco can produce both swords and belts. Each country has a total of 40 available labor hours for the production of swords and belts. Table 9-12 shows the output per hour of work, the production and consumption quantities without trade, and the production numbers with trade.
-Refer to Table 9-12. What is the opportunity cost to produce 1 sword in Estonia?
(Multiple Choice)
4.9/5 (31)
Figure 9-4 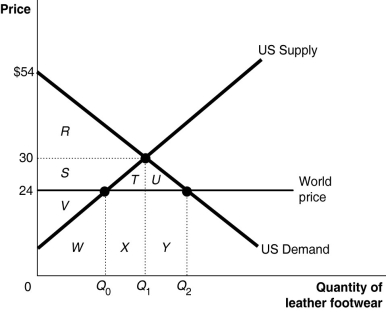 Figure 9-4 shows the U.S. demand and supply for leather footwear.
-Refer to Figure 9-4. Suppose the government allows imports of leather footwear into the United States. The market price falls to $24. What area represents consumer surplus?
Figure 9-4 shows the U.S. demand and supply for leather footwear.
-Refer to Figure 9-4. Suppose the government allows imports of leather footwear into the United States. The market price falls to $24. What area represents consumer surplus?
(Multiple Choice)
4.8/5 (30)
An economic principle that explains why countries produce different goods and services is
(Multiple Choice)
4.7/5 (45)
Figure 9-1 Figure 9-1 shows the U.S. demand and supply for leather footwear.
-Refer to Figure 9-1. Suppose the government allows imports of leather footwear into the United States. The market price falls to $18. What is the value of domestic producer surplus?
(Multiple Choice)
4.8/5 (34)
Figure 9-3 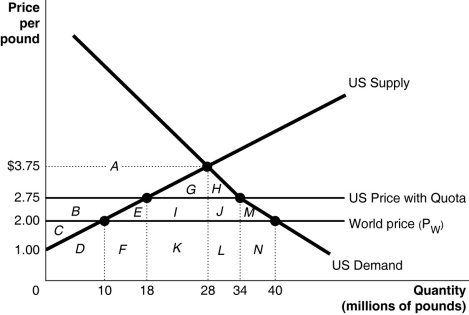 Since 1953 the United States has imposed a quota to limit the imports of peanuts. Figure 9-3 illustrates the impact of the quota.
-Refer to Figure 9-3. With a quota in place, what is the quantity consumed in the domestic market?
Since 1953 the United States has imposed a quota to limit the imports of peanuts. Figure 9-3 illustrates the impact of the quota.
-Refer to Figure 9-3. With a quota in place, what is the quantity consumed in the domestic market?
(Multiple Choice)
4.9/5 (36)
The increase in unemployment in the United States that resulted from the China shock
(Multiple Choice)
4.9/5 (40)
Jobs lost to foreign trade are generally easy to identify, but jobs created by foreign trade are generally less easy to identify.
(True/False)
4.9/5 (34)
Which of the following is not a source of comparative advantage?
(Multiple Choice)
4.9/5 (37)
The U.S. economy would gain from the elimination of tariffs and quotas even if other countries do not reduce their tariffs and quotas.
(True/False)
4.9/5 (43)
Table 9-11
Output per hour Production and Production
of work Consumption without Trade with Trade
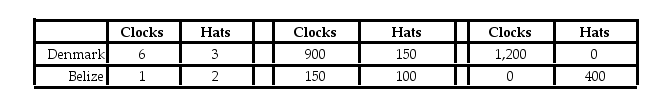 Denmark and Belize can produce both clocks and hats. Each country has a total of 200 available labor hours for the production of clocks and hats. Table 9-11 shows the output per hour of work, the production and consumption quantities without trade, and the production numbers with trade.
-Refer to Table 9-11. All of the following are terms of trade that could possibly benefit both countries except
Denmark and Belize can produce both clocks and hats. Each country has a total of 200 available labor hours for the production of clocks and hats. Table 9-11 shows the output per hour of work, the production and consumption quantities without trade, and the production numbers with trade.
-Refer to Table 9-11. All of the following are terms of trade that could possibly benefit both countries except
(Multiple Choice)
4.9/5 (38)
Table 9-11
Output per hour Production and Production
of work Consumption without Trade with Trade
Denmark and Belize can produce both clocks and hats. Each country has a total of 200 available labor hours for the production of clocks and hats. Table 9-11 shows the output per hour of work, the production and consumption quantities without trade, and the production numbers with trade.
-Refer to Table 9-11. Which country has a comparative advantage in producing clocks?
(Multiple Choice)
4.8/5 (31)
Filters
- Essay(0)
- Multiple Choice(0)
- Short Answer(0)
- True False(0)
- Matching(0)