Exam 8: Using Data Tables and Excel Scenarios for What-If Analysis
Exam 1: Applying Fundamental Excel Skills and Tools in Problem Solving150 Questions
Exam 2: Solving Problems with Statistical Analysis Tools150 Questions
Exam 3: Determining Effective Data Display with Charts150 Questions
Exam 4: Applying Logic in Decision Making150 Questions
Exam 5: Retrieving Data for Computation, Analysis, and Reference150 Questions
Exam 6: Evaluating the Financial Impact of Loans and Investments150 Questions
Exam 7: Organizing Data for Effective Analysis150 Questions
Exam 8: Using Data Tables and Excel Scenarios for What-If Analysis150 Questions
Exam 9: Enhancing Decision Making with Solver150 Questions
Exam 10: Troubleshooting Workbooks and Automating Excel Applications150 Questions
Select questions type
Technically, the number of scenarios you can create is limited only by your computer's memory, but scenario reports can include data from only the first 15 scenarios.
(True/False)
4.7/5  (39)
(39)
When you create a scenario summary report, Excel generates it as a ____ in the workbook.
(Multiple Choice)
4.8/5 (36)
A ____ is running a what-if analysis on realistic but not actual data.
(Multiple Choice)
4.8/5 (27)
Both one-variable data tables and two-variable data tables have ____________________ cells, which contain formulas that involve the input cells in their calculations in some way.
(Short Answer)
4.8/5 (26)
What are what-if analysis, break-even analysis, and sensitivity analysis? Please include an example of a situation using each type of analysis (one example each).
(Essay)
4.8/5 (41)
To make the scenario summary easy to interpret and distribute, Excel ____.
(Multiple Choice)
4.9/5 (42)
A one-variable data table allows only one input assumption to vary.
(True/False)
4.8/5 (35)
Although data tables and scenarios are ideal for showing the results of the interaction of a number of variables, analyzing which results are more likely than others depends on your knowledge of your business and markets.
(True/False)
4.7/5 (33)
Instead of listing all the cells, a scenario summary report shows the values for all ____ cells and for all indicated result cells for all scenarios.
(Multiple Choice)
4.9/5 (34)
You set up and print both types of scenario reports from the Scenario Manager dialog box by clicking the ____ button to open the Scenario Summary dialog box.
(Multiple Choice)
4.8/5 (28)
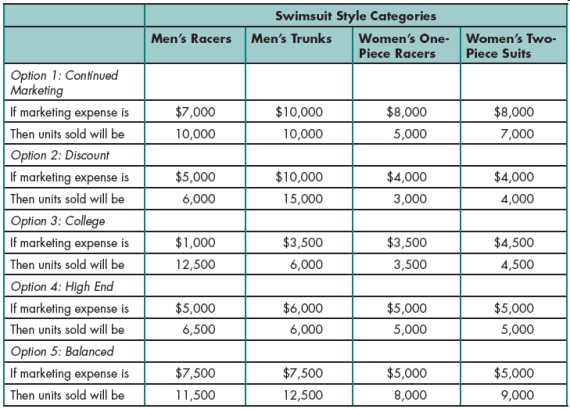 Gabriel created the table above to help him organize financial information on the projected results of increased marketing campaigns for the swimsuit line. A change in marketing expense will change the number of units sold. Please refer to the table above when answering the questions below.
-Gabriel wants to edit his scenario. He can change everything below EXCEPT ____.
Gabriel created the table above to help him organize financial information on the projected results of increased marketing campaigns for the swimsuit line. A change in marketing expense will change the number of units sold. Please refer to the table above when answering the questions below.
-Gabriel wants to edit his scenario. He can change everything below EXCEPT ____.
(Multiple Choice)
4.9/5 (35)
You use a ____ when you want to ask a what-if question involving a range of values.
(Multiple Choice)
4.8/5 (35)
A one-variable data table allows you to compare results calculated from changes to ____ input value(s).
(Multiple Choice)
4.9/5 (37)
In preparation for executing the command to complete the data table, first select the ____ that will constitute the completed data table.
(Multiple Choice)
4.8/5 (19)
A(n) ____________________ table is a range of cells containing values and formulas that let you perform many calculations at once, and then compare the results of these variations on a single worksheet.
(Short Answer)
4.8/5 (37)
You must structure a two-variable data table so that the input values are perpendicular to each other, and so that the table's output formula is located ____ the two sets of input variables.
(Multiple Choice)
4.8/5 (36)
A(n) ____________________ margin is calculated by subtracting variable expenses from sales, and represents the amount of revenue that contributes to covering the fixed expenses of a company.
(Short Answer)
4.8/5 (38)
A data table depends on values and formulas used in a worksheet, and must appear ____ that contains this data.
(Multiple Choice)
4.9/5 (40)
After you create a PivotTable report, you can analyze the information in a different form by generating an associated ____, which contains the same elements as a regular Excel chart.
(Multiple Choice)
4.9/5 (37)
Filters
- Essay(0)
- Multiple Choice(0)
- Short Answer(0)
- True False(0)
- Matching(0)