Exam 8: Using Data Tables and Excel Scenarios for What-If Analysis
Exam 1: Applying Fundamental Excel Skills and Tools in Problem Solving150 Questions
Exam 2: Solving Problems with Statistical Analysis Tools150 Questions
Exam 3: Determining Effective Data Display with Charts150 Questions
Exam 4: Applying Logic in Decision Making150 Questions
Exam 5: Retrieving Data for Computation, Analysis, and Reference150 Questions
Exam 6: Evaluating the Financial Impact of Loans and Investments150 Questions
Exam 7: Organizing Data for Effective Analysis150 Questions
Exam 8: Using Data Tables and Excel Scenarios for What-If Analysis150 Questions
Exam 9: Enhancing Decision Making with Solver150 Questions
Exam 10: Troubleshooting Workbooks and Automating Excel Applications150 Questions
Select questions type
To set up a scenario, you create or use a worksheet that contains sets of input and output cells, as you do with data tables. For example, in a worksheet listing sales assumptions and projections, the projections are ____.
(Multiple Choice)
4.9/5  (33)
(33)
A(n) PivotChart report is an interactive table that groups and summarizes information in a concise format so you can easily analyze the information. _________________________
(True/False)
4.8/5 (29)
Defined names with a local or global scope can be created using the Define Name command in the Defined Names group on the ____ tab on the ribbon.
(Multiple Choice)
4.9/5 (26)
Creating the structure for a data table involves creating the set of input values you want to use in a what-if analysis and indicating the results you want to see in the target table. _________________________
(True/False)
4.9/5 (30)
Identify the letter of the choice that best matches the word or phrase with its definition.
-The Scenario Manager's version of input cells
(Multiple Choice)
4.8/5 (32)
A range name, also called a(n) ____________________ name, can refer to a cell, range of cells, formula, or constant value in Excel.
(Short Answer)
4.8/5 (29)
You can use the Scenario Manager dialog box to change a scenario's ____.
(Multiple Choice)
4.8/5 (30)
You can use two-variable data tables to base a what-if analysis on realistic, but not actual, data. Doing so is called running a(n) situation. _________________________
(True/False)
4.8/5 (28)
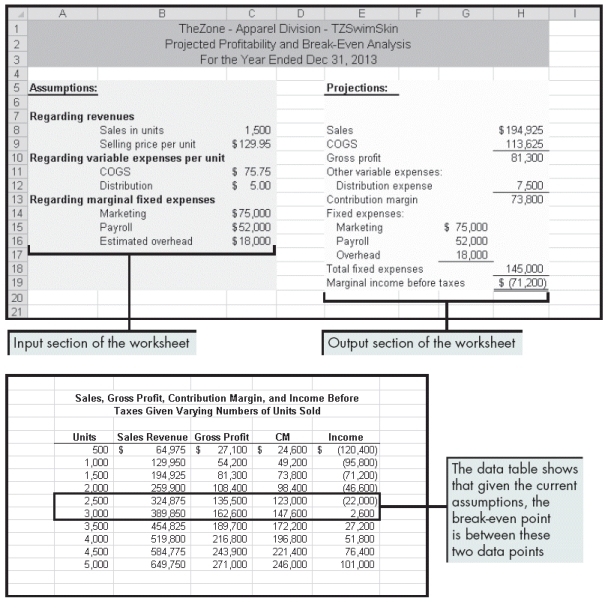 Beckham created the worksheets above to show the profitability and break-even points for his company. Please refer to the figure above as you answer the questions below.
-To conduct a sensitivity analysis, Beckham can ask: ____.
Beckham created the worksheets above to show the profitability and break-even points for his company. Please refer to the figure above as you answer the questions below.
-To conduct a sensitivity analysis, Beckham can ask: ____.
(Multiple Choice)
4.8/5 (28)
Because you can compare the results of many calculations in data tables, they can be very useful when performing a ____ analysis.
(Multiple Choice)
4.8/5 (35)
Identify the letter of the choice that best matches the word or phrase with its definition.
-A range of cells containing values and formulas
(Multiple Choice)
4.8/5 (33)
A defined name can have a scope for the entire workbook, which is referred to as the ____________________ level.
(Short Answer)
4.8/5 (33)
The ____ function generates a random number between 0 and 1.
(Multiple Choice)
4.8/5 (32)
Rough analysis is a type of what-if analysis that attempts to examine how sensitive the results of an analysis are to changes in the assumptions. _________________________
(True/False)
4.8/5 (36)
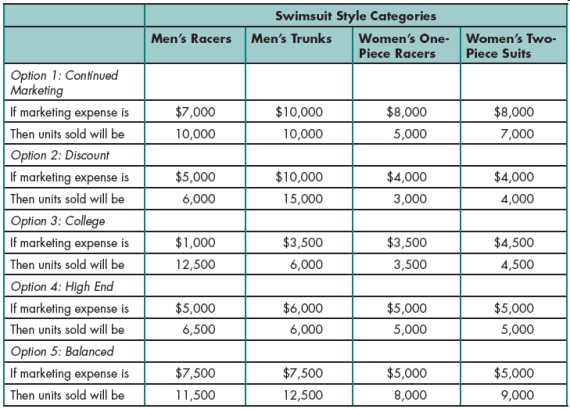 Gabriel created the table above to help him organize financial information on the projected results of increased marketing campaigns for the swimsuit line. A change in marketing expense will change the number of units sold. Please refer to the table above when answering the questions below.
-Gabriel plans to name the input and result cells with range names. What would you recommend the name be for Option 3, "High End"?
Gabriel created the table above to help him organize financial information on the projected results of increased marketing campaigns for the swimsuit line. A change in marketing expense will change the number of units sold. Please refer to the table above when answering the questions below.
-Gabriel plans to name the input and result cells with range names. What would you recommend the name be for Option 3, "High End"?
(Multiple Choice)
4.9/5 (34)
To view a scenario in the worksheet, click the scenario name in the Scenario Manager dialog box, and then click the ____ button.
(Multiple Choice)
4.7/5 (36)
In financial statistics, a probability distribution assigns a probability to every ____.
(Multiple Choice)
4.8/5 (36)
The contribution margin represents the amount of revenue that can contribute to covering the fixed expenses of a company. _________________________
(True/False)
4.9/5 (35)
A(n) one-variable data table has only one input cell and many result cells. _________________________
(True/False)
4.9/5 (41)
Identify the letter of the choice that best matches the word or phrase with its definition.
-A one-output formula that shows the results of the interaction of two different sets of input values
(Multiple Choice)
4.8/5 (36)
Filters
- Essay(0)
- Multiple Choice(0)
- Short Answer(0)
- True False(0)
- Matching(0)