Exam 8: Using Data Tables and Excel Scenarios for What-If Analysis
Exam 1: Applying Fundamental Excel Skills and Tools in Problem Solving150 Questions
Exam 2: Solving Problems with Statistical Analysis Tools150 Questions
Exam 3: Determining Effective Data Display with Charts150 Questions
Exam 4: Applying Logic in Decision Making150 Questions
Exam 5: Retrieving Data for Computation, Analysis, and Reference150 Questions
Exam 6: Evaluating the Financial Impact of Loans and Investments150 Questions
Exam 7: Organizing Data for Effective Analysis150 Questions
Exam 8: Using Data Tables and Excel Scenarios for What-If Analysis150 Questions
Exam 9: Enhancing Decision Making with Solver150 Questions
Exam 10: Troubleshooting Workbooks and Automating Excel Applications150 Questions
Select questions type
Excel can be used to create two types of data tables: one-variable data tables and ____ data tables.
(Multiple Choice)
4.8/5  (33)
(33)
Scenario summary reports are created with ____ as the worksheet title.
(Multiple Choice)
4.7/5 (39)
In a two-variable data table, you can vary the values of two input variables, and show the results for ____ output value(s).
(Multiple Choice)
4.9/5 (37)
Identify the letter of the choice that best matches the word or phrase with its definition.
-A multiple-output formula that shows the results that come from one set of input values
(Multiple Choice)
4.8/5 (44)
A ____ analysis asks, "How much will projected profits change if the cost of goods sold per unit changes by $1? By $2?"
(Multiple Choice)
4.9/5 (35)
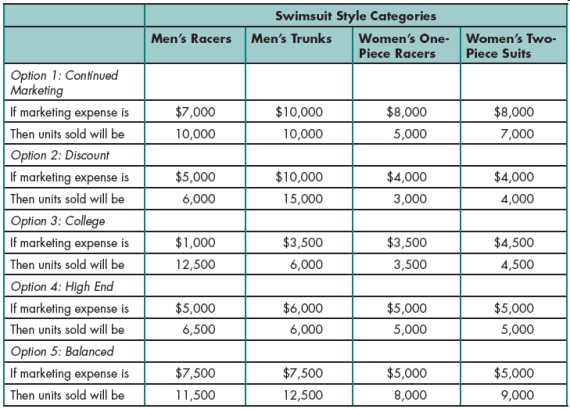 Gabriel created the table above to help him organize financial information on the projected results of increased marketing campaigns for the swimsuit line. A change in marketing expense will change the number of units sold. Please refer to the table above when answering the questions below.
-Gabriel plans to use the Scenario Manager to add a scenario. He opens the Scenario Manager by clicking the DATA tab on the ribbon, and then clicking the ____.
Gabriel created the table above to help him organize financial information on the projected results of increased marketing campaigns for the swimsuit line. A change in marketing expense will change the number of units sold. Please refer to the table above when answering the questions below.
-Gabriel plans to use the Scenario Manager to add a scenario. He opens the Scenario Manager by clicking the DATA tab on the ribbon, and then clicking the ____.
(Multiple Choice)
4.9/5 (32)
You can use the Scenario ____________________ to perform a what-if analysis with more than two input cells.
(Short Answer)
4.8/5 (33)
A(n) source table is a range of cells containing values and formulas. _________________________
(True/False)
4.8/5 (32)
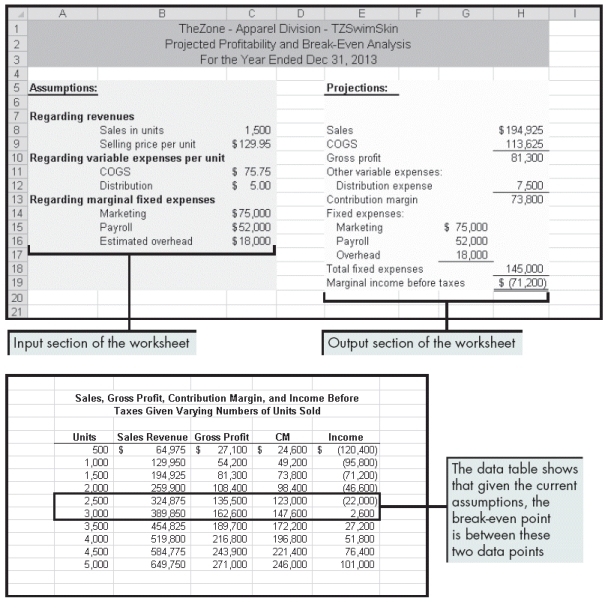 Beckham created the worksheets above to show the profitability and break-even points for his company. Please refer to the figure above as you answer the questions below.
-Beckham has received new information regarding some of the assumptions. The estimate of the COGS per unit has changed from $75.75 to $95.00, and the estimated marketing expense has been cut from $75,000 to $60,000. What should Beckham do to show this change in the worksheet above?
Beckham created the worksheets above to show the profitability and break-even points for his company. Please refer to the figure above as you answer the questions below.
-Beckham has received new information regarding some of the assumptions. The estimate of the COGS per unit has changed from $75.75 to $95.00, and the estimated marketing expense has been cut from $75,000 to $60,000. What should Beckham do to show this change in the worksheet above?
(Multiple Choice)
4.8/5 (40)
A contribution margin is calculated by subtracting variable expenses from sales, and represents the amount of revenue that contributes to covering the ____ expenses of a company.
(Multiple Choice)
4.8/5 (38)
There is no right answer to the question of whether the effect of income taxes should be considered when performing what-if analysis.
(True/False)
4.8/5 (34)
The ____________________ function is very useful when you want to sum a series of products, as long as the ranges involved are parallel to each other in the worksheet.
(Short Answer)
5.0/5 (31)
MATCHING
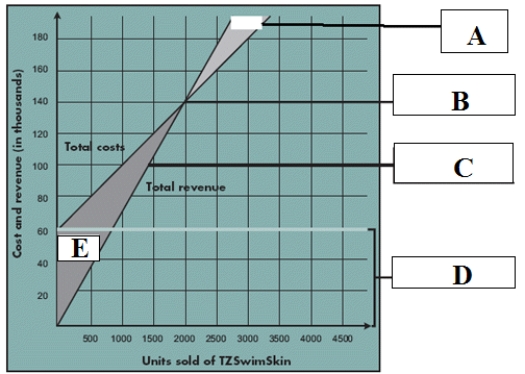 Identify the letter of the choice that best matches the break-even point in the chart above.
-Loss
Identify the letter of the choice that best matches the break-even point in the chart above.
-Loss
(Multiple Choice)
4.7/5 (27)
A ____ extracts, organizes, and summarizes data so you can analyze it by making comparisons, detecting patterns and relationships, and recognizing trends.
(Multiple Choice)
4.9/5 (36)
Identify the letter of the choice that best matches the word or phrase with its definition.
-Data table cells containing values that can vary
(Multiple Choice)
4.9/5 (34)
Gabriel created the table above to help him organize financial information on the projected results of increased marketing campaigns for the swimsuit line. A change in marketing expense will change the number of units sold. Please refer to the table above when answering the questions below.
-Gabriel needs to create five scenarios in the Swimwear worksheet. To do so, he needs to determine the changing cells in the worksheet. Which input values change under the various options, and what will the changing cells be in his scenarios?
(Multiple Choice)
5.0/5 (32)
Although you can use generic names for your scenarios, you should use more descriptive names because they appear on any scenario summary reports you ____.
(Multiple Choice)
4.7/5 (38)
Open the Scenario Manager by clicking the DATA tab on the ribbon, clicking the ____ analysis button in the Data Tools group, and then clicking Scenario Manager.
(Multiple Choice)
4.8/5 (41)
Both one-variable data tables and two-variable data tables have ____________________ cells, which are the cells containing values that can vary.
(Short Answer)
4.9/5 (32)
Changing cells and result cells are listed by the names you gave them when you ____.
(Multiple Choice)
4.7/5 (27)
Filters
- Essay(0)
- Multiple Choice(0)
- Short Answer(0)
- True False(0)
- Matching(0)