Exam 3: Numerical Summaries of Center and Variation
Exam 1: Introduction to Data60 Questions
Exam 2: Picturing Variation With Graphs60 Questions
Exam 3: Numerical Summaries of Center and Variation60 Questions
Exam 4: Regression Analysis: Exploring Associations Between Variables60 Questions
Exam 5: Modeling Variation With Probability60 Questions
Exam 6: Modeling Random Events: the Normal and Binomial Models60 Questions
Exam 7: Survey Sampling and Inference60 Questions
Exam 8: Hypothesis Testing for Population Proportions60 Questions
Exam 9: Inferring Population Means60 Questions
Exam 10: Associations Between Categorical Variables60 Questions
Exam 11: Multiple Comparisons and Analysis of Variance60 Questions
Exam 12: Experimental Design: Controlling Variation60 Questions
Exam 13: Inference Without Normality59 Questions
Exam 14: Inference for Regression60 Questions
Select questions type
Use the following data to answer the question. Here are the scores on a recent statistics midterm exam (Scores have been listed from lowest to highest). A histogram showing the distribution is also included.
 -Which measure of center, mean or median, would be most appropriate, and why? Using the data and the histogram, find the approximate value of the appropriate measure of center, and describe how you found it.
(Essay)
4.8/5  (34)
(34)
The following list shows the age at appointment of U.S. Supreme Court Chief Justices appointed since 1900. Use the data to answer the question.
 -The U.S. Supreme Court Chief Justice data was used to create the following output in an Excel spreadsheet. Choose the statement that best summarizes the variability of the dataset.
(Multiple Choice)
4.9/5 (37)
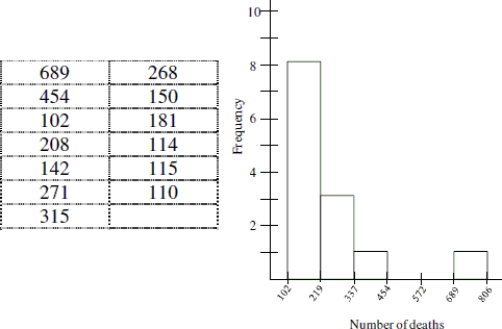
Use the following information to answer the question. Here is a table recording the number of deaths for the top thirteen worst U.S. tornados since 1925. A histogram showing the distribution is also included.
 -Choose the most appropriate measure of center then calculate the typical value rounded to the nearest tenth.
(Multiple Choice)
4.9/5 (38)
Use the following information to answer the question. Here is a table recording the number of deaths for the top thirteen worst U.S. tornados since 1925. A histogram showing the distribution is also included.
 -Estimate the most appropriate measure of variability.
(Multiple Choice)
4.8/5 (33)
Pick the statement that best describes the shape of the distribution for the states in the West.
(Multiple Choice)
4.8/5 (32)
A school board member says, "The typical bus ride to school for a student living in the city limits is more than the bus ride to school for a student living in the suburbs." What does this statement mean?
(Multiple Choice)
4.9/5 (44)
The following list shows the age at appointment of U.S. Supreme Court Chief Justices appointed since 1900. Use the data to answer the question.
 -The U.S. Supreme Court Chief Justice data was used to create the following output in an Excel spreadsheet. Choose the statement that best summarizes the variability of the dataset.
(Multiple Choice)
5.0/5 (28)
Calculate the five- number summary for the following dataset. 
(Multiple Choice)
5.0/5 (30)
Between what two values would you expect to find about 95% of the lead actors ages?
(Multiple Choice)
4.8/5 (35)
Below is the standard deviation for extreme 10k finish times for a randomly selected group of women and men. Chose the statement that best summarizes the meaning of the standard deviation. 
(Multiple Choice)
4.7/5 (37)
Use the following information to answer the question. In 2007, the average number of hours spent online at home for U. S. adults with internet access was 8.9 hours with a standard deviation of 0.4 hours. The U. S average was determined by collecting cluster data from thirty randomly selected states. Assume the distribution of time spent online at home is approximately unimodal and symmetric.
-If a new report came out saying that on average, Floridian adults spent 8.0 hours online while at home, would you say this was an unusual value? If it was unusual, explain how you reached your conclusion and whether it was unusually high or low.
(Short Answer)
4.9/5 (36)
Use the following information for the question. The boxplots below are from a Graphing Calulator. The boxplots summarize the cost in dollars of a typical evening out for two people (dinner and a movie)in two different cities in west Michigan, Muskegon (top boxplot)and Grand Rapids (bottom boxplot). The five- number summaries are also given for each city.
 -Explain which city you think is more economical for an evening out and why. Be sure to comment on differences in typical value and variation for each city.
(Essay)
4.9/5 (39)
Based on the boxplot for the Midwest, which of the following is true?
(Multiple Choice)
4.7/5 (43)
Eric is contemplating whether to accept a job offer in an unfamiliar city. The move would mean buying a new home for his family of five people. He is curious about typical home prices in the new city. Which information would more useful to him, average house prices or median house prices? Explain.
(Essay)
4.7/5 (41)
Use the following information to answer the question. Here is a table recording the number of deaths for the top thirteen worst U.S. tornados since 1925. A histogram showing the distribution is also included.
 -Estimate the most appropriate measure of variability.
(Multiple Choice)
4.8/5 (38)
Use the following information to answer the question. The average snowfall for cities in Michigan is 71.6 inches with a standard deviation of 9.7 inches. Assume the distribution for annual snowfall is approximately unimodal and symmetrical.
-What is the range of values for annual snowfall that would contain roughly 68% of the cities in Michigan? Round calculations to the nearest tenth.
(Short Answer)
4.8/5 (34)
Use the following data to answer the question. Here are the scores on a recent statistics midterm exam (Scores have been listed from lowest to highest). A histogram showing the distribution is also included.
 -The worst midterm grade was received by a student who was absent the week prior to the exam due to illness. Should this grade be considered an outlier? Explain and support your reasoning. Be sure to state what you would do with this data value.
(Essay)
4.8/5 (29)
The following nine values represent race finish times in hours for a randomly selected group of participants in an extreme 10k race (a 10k race with obstacles). Which of the following is closest to the mean of the following data set? 


(Multiple Choice)
4.9/5 (34)
Use the following information to answer the question. The mean age of lead actors from the top ten grossing movies of 2007 was 36.4 years with a standard deviation of 9.87 years. Assume the distribution of the actors ages is approximately unimodal and symmetric.
-In 2007, popular actor and singer Justin Timberlake was 26- years- old. What is Justin Timberlake's age in 2007 if it is standardized? Would it be unusual for a 26- year- old actor to be in a top- grossing film of 2007? Assume the Empirical Rule applies and round to the nearest hundredth.
(Multiple Choice)
4.8/5 (32)
Use the following information to answer the question. In 2007, the average number of hours spent online at home for U. S. adults with internet access was 8.9 hours with a standard deviation of 0.4 hours. The U. S average was determined by collecting cluster data from thirty randomly selected states. Assume the distribution of time spent online at home is approximately unimodal and symmetric.
-What is the range of time spent online at home for 95% of adults with internet access? Round to the nearest tenth.
(Short Answer)
4.8/5 (27)
Filters
- Essay(0)
- Multiple Choice(0)
- Short Answer(0)
- True False(0)
- Matching(0)