Exam 13: Modeling Data with Linear Functions
Exam 1: Functions Given by Formulas38 Questions
Exam 2: Functions Given by TableChas13 Questions
Exam 3: Functions Given by Graphs38 Questions
Exam 4: Functions Given by Words26 Questions
Exam 5: Table and Trends34 Questions
Exam 6: Graphs37 Questions
Exam 7: Solving Linear Equations35 Questions
Exam 8: Solving Nonlinear Equations38 Questions
Exam 9: Inequalities39 Questions
Exam 10: Optimization36 Questions
Exam 11: The Geometry of Lines46 Questions
Exam 12: Linear Functions39 Questions
Exam 13: Modeling Data with Linear Functions8 Questions
Exam 14: Linear Regression5 Questions
Exam 15: Systems of Equations40 Questions
Exam 16: Exponential Growth and Decay41 Questions
Exam 17: Constant Percentage Change31 Questions
Exam 18: Modeling Exponential Data7 Questions
Exam 19: Modeling Nearly Exponential Data5 Questions
Exam 20: Logarithmic Functions41 Questions
Exam 21: Logistic Functions35 Questions
Exam 22: Power Functions41 Questions
Exam 23: Modeling Data with Power Functions4 Questions
Exam 24: Combining and Decomposing Functions36 Questions
Exam 25: Quadratic Functions24 Questions
Exam 26: Higher Degree Polynomials and Rational Functions27 Questions
Exam 27: Velocity49 Questions
Exam 28: Rates of Change for Other Functions40 Questions
Exam 29 Estimating Rates of Change27 Questions
Exam 30: Equations of Change Linear and Exponential Functions30 Questions
Exam 31: Equations of Change Graphical Solutions39 Questions
Select questions type
The graph shown below can be appropriately modeled by a linear function. 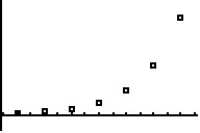
Free
(True/False)
4.8/5  (32)
(32)
Correct Answer: Verified
False
A data table for  with evenly spaced values for x can be modeled with a linear function if it shows a constant change in y.
Free
(True/False)
4.8/5 (37)
Correct Answer:Verified
True
Suppose f is a linear function and that  .Then the slope of f is negative.
Free
(True/False)
4.8/5 (43)
Correct Answer:Verified
False
If data for  are linear, then the plot of the data falls on a straight line.
(True/False)
4.9/5 (31)
The graph shown below can be appropriately modeled by a linear function. 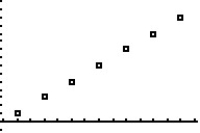
(True/False)
4.7/5 (43)
Suppose f is a linear function and that  , and
, and  .Then the slope of f is positive.
(True/False)
4.7/5 (25)
If data for  are linear, then the slope of the linear function is the change in y.
(True/False)
4.8/5 (44)
Suppose f is a linear function and that  , and
, and  .Then the slope of f is positive.
(True/False)
4.8/5 (38)
Filters
- Essay(0)
- Multiple Choice(0)
- Short Answer(0)
- True False(0)
- Matching(0)