Exam 3: Functions Given by Graphs
Exam 1: Functions Given by Formulas38 Questions
Exam 2: Functions Given by TableChas13 Questions
Exam 3: Functions Given by Graphs38 Questions
Exam 4: Functions Given by Words26 Questions
Exam 5: Table and Trends34 Questions
Exam 6: Graphs37 Questions
Exam 7: Solving Linear Equations35 Questions
Exam 8: Solving Nonlinear Equations38 Questions
Exam 9: Inequalities39 Questions
Exam 10: Optimization36 Questions
Exam 11: The Geometry of Lines46 Questions
Exam 12: Linear Functions39 Questions
Exam 13: Modeling Data with Linear Functions8 Questions
Exam 14: Linear Regression5 Questions
Exam 15: Systems of Equations40 Questions
Exam 16: Exponential Growth and Decay41 Questions
Exam 17: Constant Percentage Change31 Questions
Exam 18: Modeling Exponential Data7 Questions
Exam 19: Modeling Nearly Exponential Data5 Questions
Exam 20: Logarithmic Functions41 Questions
Exam 21: Logistic Functions35 Questions
Exam 22: Power Functions41 Questions
Exam 23: Modeling Data with Power Functions4 Questions
Exam 24: Combining and Decomposing Functions36 Questions
Exam 25: Quadratic Functions24 Questions
Exam 26: Higher Degree Polynomials and Rational Functions27 Questions
Exam 27: Velocity49 Questions
Exam 28: Rates of Change for Other Functions40 Questions
Exam 29 Estimating Rates of Change27 Questions
Exam 30: Equations of Change Linear and Exponential Functions30 Questions
Exam 31: Equations of Change Graphical Solutions39 Questions
Select questions type
The graph below shows the growth rate G, in water fleas per day, of a population of water fleas as a function of the population size N.Calculate the average rate of change in G from 130 to 160 water fleas. 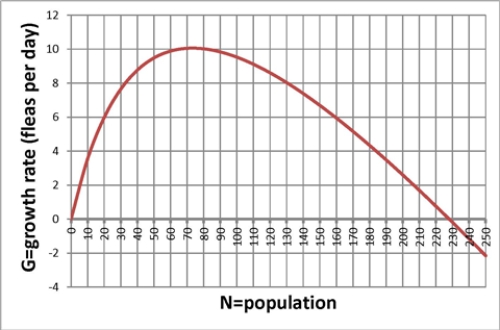
Free
(Multiple Choice)
4.7/5  (29)
(29)
Correct Answer: Verified
A
The graph below shows the maximum angle above the horizon reached by the moon during the month of June.On what day does the smallest maximum angle occur, and what is that angle? 
Free
(Multiple Choice)
4.7/5 (33)
Correct Answer:Verified
C
The graph below shows the numbers, in thousands, of men and women of a given height in a population.What are the most common heights for men and for women? 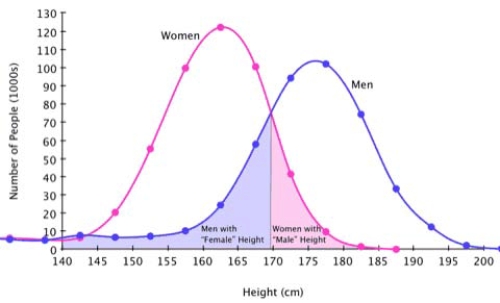
Free
(Multiple Choice)
4.9/5 (35)
Correct Answer:Verified
B
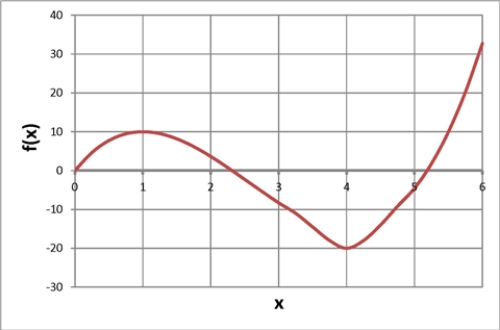
Below is a graph of a function  .Over what region(s) is the function decreasing?
(Multiple Choice)
4.9/5 (36)
The graph below shows the maximum angle above the horizon reached by the moon during the month of June.What was the average rate of change in the maximum angle from June 8 to June 14? 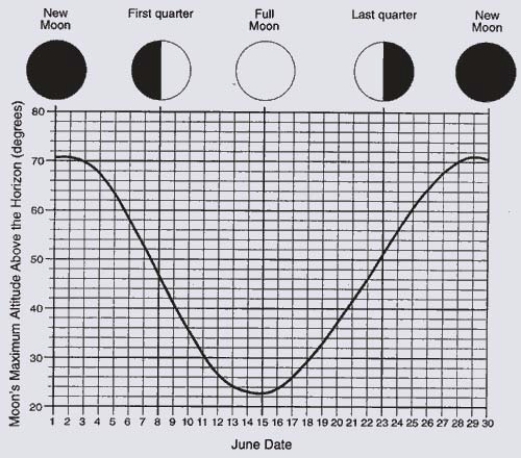
(Multiple Choice)
4.7/5 (41)
The graph of a function that is decreasing at a decreasing rate is decreasing and concave up.
(True/False)
4.9/5 (40)
The graph below shows the atmospheric pressure, in millibars of mercury, as a function of altitude in meters.According to the graph, which of the following sentences best describes the relationship between pressure and altitude? 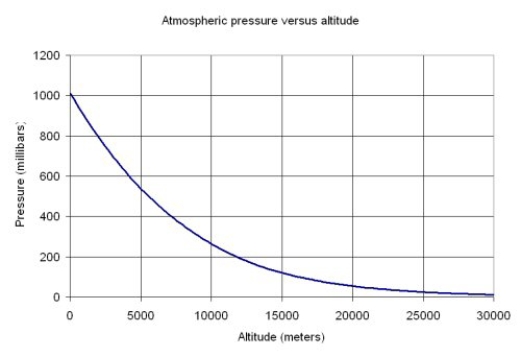
(Multiple Choice)
4.7/5 (43)
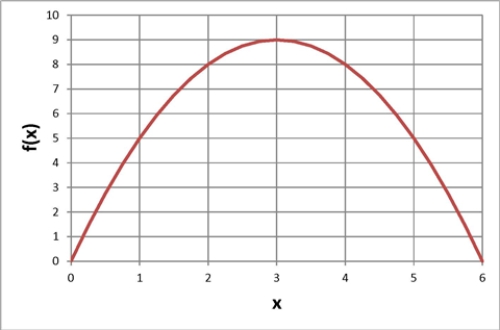
Below is a graph of a function  .At what value of x does f reach its maximum value, and what is that value?
(Multiple Choice)
4.8/5 (27)
Below is a graph of a function  .Find the largest value of x so that
  .
. 
(Multiple Choice)
4.8/5 (32)
Below is a graph of a function  .What is the limiting value for f?
(Multiple Choice)
4.9/5 (34)
Below is a graph of a function  .Find the average rate of change in f from 4 to 10 .
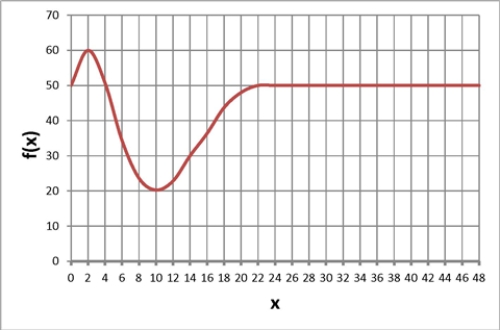
(Multiple Choice)
4.7/5 (31)
Choose the answer that best completes the following sentence.A graph that is decreasing and concave up represents a function that is ...
(Multiple Choice)
4.8/5 (39)
A graph that is concave up represents a function that is increasing.
(True/False)
4.8/5 (42)
Which of the following stories best fits the graph below? 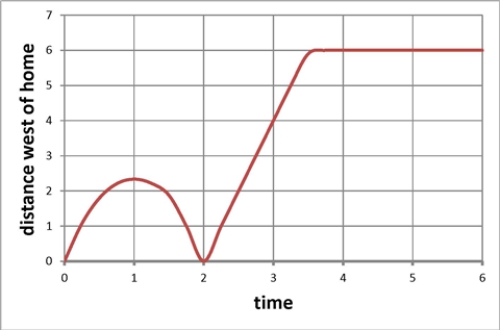
(Multiple Choice)
4.7/5 (31)
The graph below shows the atmospheric pressure P, in millibars of mercury, as a function of altitude A in meters.According to the graph, what is the approximate value of the solution for A of the equation  ?
? 
(Multiple Choice)
4.9/5 (33)
Below is a graph of a function  .Over what region(s) is the graph concave up?

(Multiple Choice)
4.9/5 (40)
The graph of a function that is increasing at an increasing rate is increasing and concave up.
(True/False)
4.8/5 (43)
Below is a graph of a function  .At what value of x does the point of inflection occur?
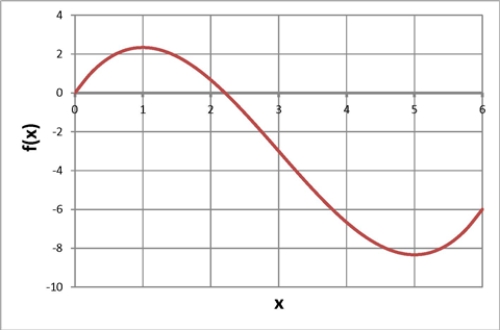
(Multiple Choice)
4.9/5 (41)
Filters
- Essay(0)
- Multiple Choice(0)
- Short Answer(0)
- True False(0)
- Matching(0)