Exam 6: Graphs
Exam 1: Functions Given by Formulas38 Questions
Exam 2: Functions Given by TableChas13 Questions
Exam 3: Functions Given by Graphs38 Questions
Exam 4: Functions Given by Words26 Questions
Exam 5: Table and Trends34 Questions
Exam 6: Graphs37 Questions
Exam 7: Solving Linear Equations35 Questions
Exam 8: Solving Nonlinear Equations38 Questions
Exam 9: Inequalities39 Questions
Exam 10: Optimization36 Questions
Exam 11: The Geometry of Lines46 Questions
Exam 12: Linear Functions39 Questions
Exam 13: Modeling Data with Linear Functions8 Questions
Exam 14: Linear Regression5 Questions
Exam 15: Systems of Equations40 Questions
Exam 16: Exponential Growth and Decay41 Questions
Exam 17: Constant Percentage Change31 Questions
Exam 18: Modeling Exponential Data7 Questions
Exam 19: Modeling Nearly Exponential Data5 Questions
Exam 20: Logarithmic Functions41 Questions
Exam 21: Logistic Functions35 Questions
Exam 22: Power Functions41 Questions
Exam 23: Modeling Data with Power Functions4 Questions
Exam 24: Combining and Decomposing Functions36 Questions
Exam 25: Quadratic Functions24 Questions
Exam 26: Higher Degree Polynomials and Rational Functions27 Questions
Exam 27: Velocity49 Questions
Exam 28: Rates of Change for Other Functions40 Questions
Exam 29 Estimating Rates of Change27 Questions
Exam 30: Equations of Change Linear and Exponential Functions30 Questions
Exam 31: Equations of Change Graphical Solutions39 Questions
Select questions type
The life expectancy E, in solar lifetimes, of certain stars depends on their mass M, in solar masses.The relationship is  .
Does an increase in mass have a greater effect on life expectancy for a larger star or a smaller star? A graph of E versus M can help you answer this question.
.
Does an increase in mass have a greater effect on life expectancy for a larger star or a smaller star? A graph of E versus M can help you answer this question.
(Essay)
4.8/5  (40)
(40)
The population N, in thousands, of a certain city t years after 2000 is given by 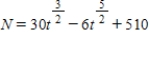 . The formula is valid over a 10-year period.Over what period was the population decreasing? A graph of N versus t can help you answer this question.
(Multiple Choice)
4.8/5 (34)
Sales S, in thousands of dollars, t months after the beginning of the year are given by  .
The formula is valid over a 12-month period.Over what period were sales increasing? A graph of S versus t can help you answer this question.
.
The formula is valid over a 12-month period.Over what period were sales increasing? A graph of S versus t can help you answer this question.
(Multiple Choice)
4.9/5 (28)
Which of the following is the graph of  on a horizontal span of 0 to 4.5?
(Multiple Choice)
4.9/5 (33)
The life expectancy E, in solar lifetimes, of certain stars depends on their mass M, in solar masses.The relationship is  . As mass increases, life expectancy decreases.What can you say about the rate of decrease? A graph of E versus M can help you answer this question.
(Multiple Choice)
4.7/5 (39)
Dye is being added to a liquid mixture.The amount A, in grams, of dye in the mixture after t minutes is given by 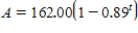 . What is the total amount of dye that is added to the solution?
(Multiple Choice)
5.0/5 (33)
The graph of a function that is increasing at a decreasing rate is concave down.
(True/False)
4.8/5 (30)
Inflection points often occur where the graph of a function is increasing most rapidly.
(True/False)
4.8/5 (39)
The height h, in centimeters, of a sunflower d days after the seed emerges is given by 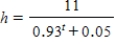 . Use a graph to estimate the tallest the sunflower will ever be.
(Multiple Choice)
4.9/5 (31)
For a satellite orbiting Earth, the time required to complete a single orbit is known as the period.The period P, in hours, is related to the distance D, in miles, from the center of Earth by the formula  . As the period increases, so does the distance.What can you say about the rate of increase in distance as period increases? A graph of D versus P can help you answer this question.
(Multiple Choice)
4.9/5 (38)
When a car skids to a stop, the length L, in feet, of the skid marks is related to the speed S, in miles per hour, of the car by the equation
 .
Does an increase in speed have a greater effect on the length of the skid marks for a car going slow or for a car going fast? A graph of L versus S can help you answer this question.
.
Does an increase in speed have a greater effect on the length of the skid marks for a car going slow or for a car going fast? A graph of L versus S can help you answer this question.
(Short Answer)
4.8/5 (36)
The amount A of adrenaline, in nanograms per liter, in a man's bloodstream t minutes after he has been frightened is given by 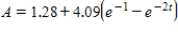 . What is the eventual amount of adrenaline in the bloodstream?
(Multiple Choice)
4.8/5 (34)
Filters
- Essay(0)
- Multiple Choice(0)
- Short Answer(0)
- True False(0)
- Matching(0)