Multiple Choice
Figure 7-13
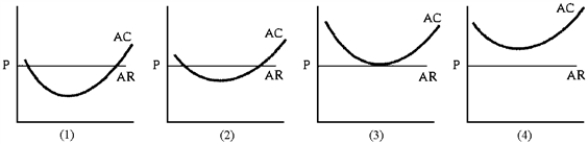
-Figure 7-13 shows the average total cost curves of four firms that produce milk.Some of the dairies are more productive.AR = P is the long-run price of milk.How many of these dairies will remain in the industry in the long run?
A) all of them
B) only 2
C) only 3
D) cannot determine with information given
Correct Answer:

Verified
Correct Answer:
Verified
Q7: Fixed cost increases when output rises.
Q22: In the short run, a firm has
Q64: Figure 7-8 <img src="https://d2lvgg3v3hfg70.cloudfront.net/TB8592/.jpg" alt="Figure 7-8
Q100: Figure 7-2 <img src="https://d2lvgg3v3hfg70.cloudfront.net/TB8592/.jpg" alt="Figure 7-2
Q107: Figure 7-9 <img src="https://d2lvgg3v3hfg70.cloudfront.net/TB8592/.jpg" alt="Figure 7-9
Q116: Production indifference curves show the combination of
Q183: Figure 7-9 <img src="https://d2lvgg3v3hfg70.cloudfront.net/TB8592/.jpg" alt="Figure 7-9
Q191: A change in input prices will change
Q192: Which of the following will not lead
Q214: If in some production range average cost