Exam 6: Elasticity and Demand
Exam 1: Managers, Profits, and Markets42 Questions
Exam 2: Demand, Supply, and Market Equilibrium86 Questions
Exam 3: Marginal Analysis for Optimal Decisions108 Questions
Exam 4: Basic Estimation Techniques51 Questions
Exam 5: Theory of Consumer Behavior70 Questions
Exam 6: Elasticity and Demand77 Questions
Exam 7: Demand Estimation and Forecasting67 Questions
Exam 8: Production and Cost in the Short Run108 Questions
Exam 9: Production and Cost in the Long Run97 Questions
Exam 10: Production and Cost Estimation55 Questions
Exam 11: Managerial Decisions in Competitive Markets90 Questions
Exam 12: Managerial Decisions for Firms With Market Power110 Questions
Exam 13: Strategic Decision Making in Oligopoly Markets63 Questions
Exam 14: Advanced Pricing Techniques57 Questions
Exam 15: Decisions Under Risk and Uncertainty59 Questions
Exam 16: Government Regulation of Business50 Questions
Select questions type
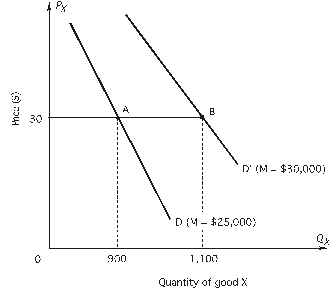
Use the figure to calculate the income elasticity of demand when income increases from $25,000 to $30,000:
Free
(Multiple Choice)
5.0/5  (32)
(32)
Correct Answer: Verified
E
Use the figure below, which shows a linear demand curve and the associated total revenue curve, to answer the questions.
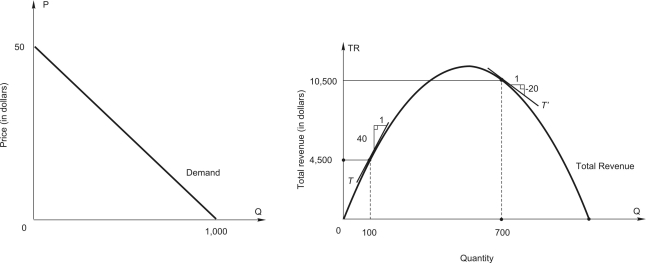 -The marginal revenue of the 100th unit is $_____.
Free
(Multiple Choice)
4.9/5 (36)
Correct Answer:Verified
C
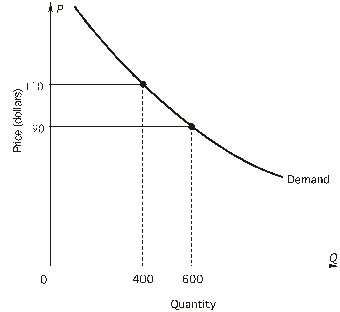
Refer to the following figure:
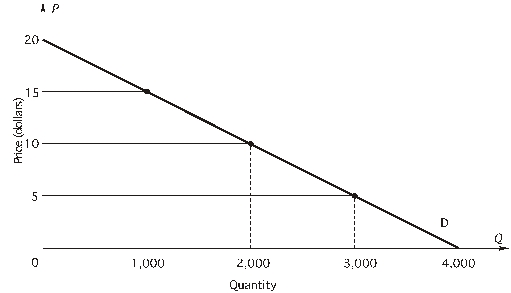 -When price is $10 and quantity demanded is 2,000, what is the point elasticity of demand?
Free
(Multiple Choice)
4.8/5 (33)
Correct Answer:Verified
C
Refer to the following figure:
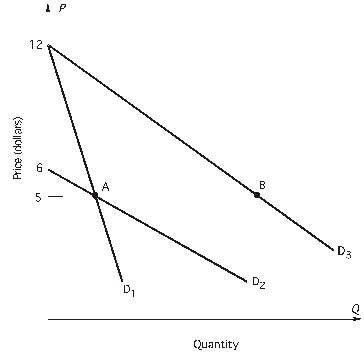 -At a price of $1, the point elasticity of demand for D2 is ________ and marginal revenue is _______.
(Multiple Choice)
4.8/5 (30)
If the price elasticity of demand for Harley-Davidson motorcycles is -1.2 and quantity demanded increases by 24%, price must have
(Multiple Choice)
4.8/5 (46)
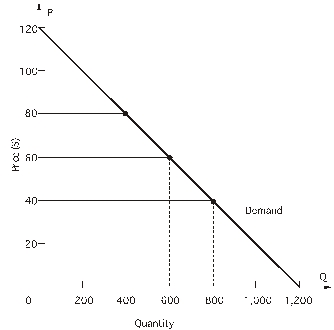 -What is the interval elasticity of demand over the price range $60 to $80?
(Multiple Choice)
4.8/5 (27)
If the quantity of Harley-Davidson motorcycles demanded decreases by 10% when the price increases by 20%, the price elasticity of demand for Harley-Davidson motorcycles is:
(Multiple Choice)
4.8/5 (31)
E1 is demand elasticity for Minutemaid orange juice, E2 is demand elasticity for all orange juice, and E3 is demand elasticity for all fruit drinks. Then
(Multiple Choice)
4.8/5 (40)
Refer to the following graph:
 -Over the price range $90 to $110, marginal revenue is ________ and demand is ________.
(Multiple Choice)
4.8/5 (34)
Refer to the following table showing a demand schedule:
Price Quantity demanded \ 200 1000 150 1400 100 1800
-If price falls from $200 to $150,
(Multiple Choice)
4.8/5 (33)
Refer to the following graph:
-Suppose price rises from $90 to $110. Total revenue moves in the ________ (same, opposite) direction as the dominant effect. In this case, total revenue ____________ (increases, decreases, stays the same) because the quantity effect is _________ (larger than, smaller than, the same as) the price effect.
(Multiple Choice)
4.8/5 (44)
Refer to the following table showing a demand schedule:
Price Quantity demanded \ 200 1000 150 1400 100 1800
-If price falls from $200 to $150,
(Multiple Choice)
4.7/5 (29)
If the quantity of gidgets demanded increases when the price of gadgets decreases
(Multiple Choice)
4.8/5 (36)
Refer to the following figure:
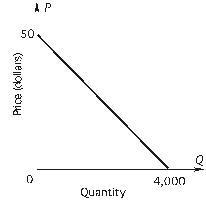 -Marginal revenue is zero at Q = ________.
(Multiple Choice)
4.8/5 (36)
-If price DECREASES from $60 to $40, an arrow representing the QUANTITY effect
(Multiple Choice)
4.8/5 (35)
Which of the following would tend to INCREASE the elasticity of demand for good X?
(Multiple Choice)
4.8/5 (34)
Total revenue increased for a firm operating in the elastic range of its demand curve. Which of the following statements is correct?
(Multiple Choice)
4.8/5 (37)
Refer to the following figure:
-Demand is unitary elastic at P = $________.
(Multiple Choice)
4.9/5 (39)
Filters
- Essay(0)
- Multiple Choice(0)
- Short Answer(0)
- True False(0)
- Matching(0)