Exam 5: Theory of Consumer Behavior
Exam 1: Managers, Profits, and Markets42 Questions
Exam 2: Demand, Supply, and Market Equilibrium86 Questions
Exam 3: Marginal Analysis for Optimal Decisions108 Questions
Exam 4: Basic Estimation Techniques51 Questions
Exam 5: Theory of Consumer Behavior70 Questions
Exam 6: Elasticity and Demand77 Questions
Exam 7: Demand Estimation and Forecasting67 Questions
Exam 8: Production and Cost in the Short Run108 Questions
Exam 9: Production and Cost in the Long Run97 Questions
Exam 10: Production and Cost Estimation55 Questions
Exam 11: Managerial Decisions in Competitive Markets90 Questions
Exam 12: Managerial Decisions for Firms With Market Power110 Questions
Exam 13: Strategic Decision Making in Oligopoly Markets63 Questions
Exam 14: Advanced Pricing Techniques57 Questions
Exam 15: Decisions Under Risk and Uncertainty59 Questions
Exam 16: Government Regulation of Business50 Questions
Select questions type
Refer to the following graphs of a consumer's indifference map and budget lines and possible demand curves:
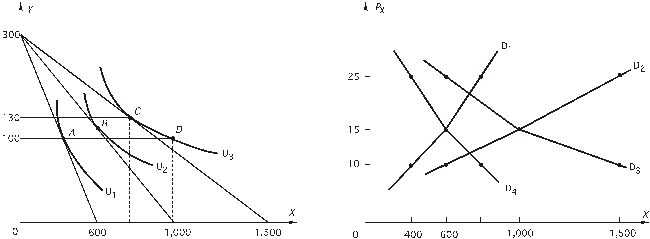 The price of Y is $50.
-The consumer's demand curve for X is
The price of Y is $50.
-The consumer's demand curve for X is
Free
(Multiple Choice)
4.8/5  (31)
(31)
Correct Answer: Verified
D
Refer to the following graphs of a consumer's indifference map and budget lines and possible demand curves:
The price of Y is $50.
-At point A,
Free
(Multiple Choice)
4.7/5 (42)
Correct Answer:Verified
D
In spending all his income, the consumer chooses the bundle of goods that maximizes his utility. Which of the following statements will be correct?
Free
(Multiple Choice)
4.9/5 (32)
Correct Answer:Verified
D
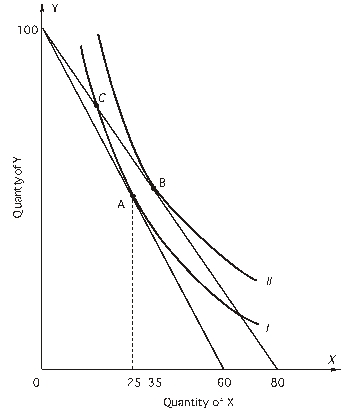
Refer to the following figure:
 The consumer's income is $800.
-What is the consumer's marginal rate of substitution in equilibrium?
The consumer's income is $800.
-What is the consumer's marginal rate of substitution in equilibrium?
(Multiple Choice)
4.8/5 (39)
For the questions , assume James purchases only two goods, steak and chicken, with his weekly income of $60. The price of steak is $10 and the price of chicken is $5. The following table shows the marginal utility James obtains from each additional pound of steak and chicken:
Quantity Marginal utility of steak Marginal utility of chicken 1 70 50 2 60 40 3 50 30 4 40 20 5 32 10
-If the price of steak falls to $8, what quantities of steak and chicken should James purchase to maximize his utility?
(Multiple Choice)
4.8/5 (27)
Refer to the following graph:
 The consumer's income is $600.
-At point C,
The consumer's income is $600.
-At point C,
(Multiple Choice)
4.7/5 (36)
Refer to the following figure:
The consumer's income is $800.
-Why doesn't the consumer choose the combination of 30X and 56Y at point A?
(Multiple Choice)
4.8/5 (45)
Ms. Birnbaum is buying bottles of beer and bags of pretzels. The marginal utility of the last bottle of beer is 60 and the marginal utility of the last bag of pretzels is 30. The price of beer is $0.30 per bottle and the price of pretzels is $0.20 per bag. Ms. Birnbaum
(Multiple Choice)
4.9/5 (40)
Refer to the following graphs of a consumer's indifference map and budget lines and possible demand curves:
The price of Y is $50.
-If U2 is the maximum attainable utility, the price of X is
(Multiple Choice)
4.8/5 (27)
If a consumer is choosing the bundle of goods that maximizes utility subject to a budget constraint, then
(Multiple Choice)
4.8/5 (26)
Refer to the following graph:
The price of X is $20 and the price of Y is $40.
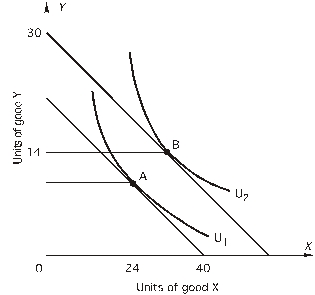 -How many units of X will the consumer choose if point B is the utility-maximizing choice?
(Multiple Choice)
4.8/5 (31)
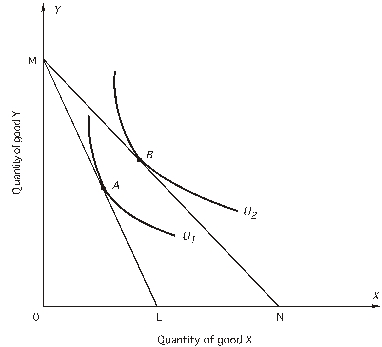 -What could have caused a consumer's budget line to shift from ML to MN?
(Multiple Choice)
4.8/5 (37)
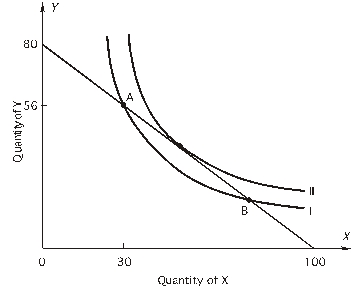
Refer to the following indifference map for a consumer who has an income of $48 to spend on goods X and Y and the market prices of X and Y are both equal to $4:
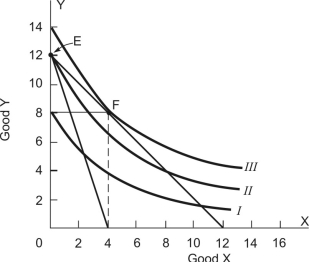 -Now suppose the price of good X increases to $12 while the price of good Y remains $4. Utility will be maximized on which indifference curve?
(Multiple Choice)
4.8/5 (42)
For questions assume that an individual consumes two goods X and Y. The total utility (assumed measurable) of each good is independent of the rate of consumption of other goods. The prices of X and Y are, respectively, $5 and $10.
Units of the Good TotalUtility of X Total Utility of Y 1 50 400 2 95 750 3 135 950 4 170 1100 5 200 1220 6 225 1320 7 245 1400 8 260 1450
-If the consumer buys the third unit of Y,
(Multiple Choice)
4.9/5 (40)
Refer to the following graph:
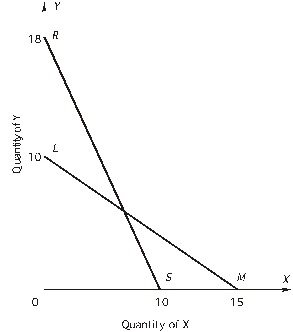 -What is the equation for budget line LM?
(Multiple Choice)
4.7/5 (29)
Filters
- Essay(0)
- Multiple Choice(0)
- Short Answer(0)
- True False(0)
- Matching(0)