Exam 8: Relative, Asset-Oriented, and Real Option
Exam 1: Introduction to Mergers, Acquisitions, and Other Restructuring Activities139 Questions
Exam 2: The Regulatory Environment129 Questions
Exam 3: The Corporate Takeover Market:152 Questions
Exam 4: Planning: Developing Business and Acquisition Plans: Phases 1 and 2 of the Acquisition Process137 Questions
Exam 5: Implementation: Search Through Closing: Phases 310 of the Acquisition Process131 Questions
Exam 6: Postclosing Integration: Mergers, Acquisitions, and Business Alliances138 Questions
Exam 7: Merger and Acquisition Cash Flow Valuation Basics108 Questions
Exam 8: Relative, Asset-Oriented, and Real Option109 Questions
Exam 9: Financial Modeling Basics:97 Questions
Exam 10: Analysis and Valuation127 Questions
Exam 11: Structuring the Deal:138 Questions
Exam 12: Structuring the Deal:125 Questions
Exam 13: Financing the Deal149 Questions
Exam 14: Applying Financial Modeling116 Questions
Exam 15: Business Alliances: Joint Ventures, Partnerships, Strategic Alliances, and Licensing138 Questions
Exam 16: Alternative Exit and Restructuring Strategies152 Questions
Exam 17: Alternative Exit and Restructuring Strategies:118 Questions
Exam 18: Cross-Border Mergers and Acquisitions:120 Questions
Select questions type
The valuation estimates in the preceding two questions are substantially different. What are the key assumptions underlying each valuation method? Be specific. How can an analyst combine the two valuation estimates assuming she believes that the enterprise to EBITDA ratio is twice as reliable as the valuation based on a revenue multiple?
(Essay)
4.9/5  (38)
(38)
The comparable companies' valuation method uses the discounted value of a firm's free cash flow.
(True/False)
4.9/5 (36)
Acquirer Incorporated's management believes that the most reliable way to value a potential target firm is by averaging multiple valuation methods, since all methods have their shortcomings. Consequently, Acquirer's Chief Financial Officer estimates that the value of Target Inc. could range, before an acquisition premium is added, from a high of $650 million using discounted cash flow analysis to a low of $500 million using the comparable companies' relative valuation method. A valuation based on a recent comparable transaction is $672 million. The CFO anticipates that Target Inc.'s management and shareholders would be willing to sell for a 20 percent acquisition premium, based on the premium paid for the recent comparable transaction. The CEO asks the CFO to provide a single estimate of the value of Target Inc. based on the three estimates. In calculating a weighted average of the three estimates, she gives a value of .5 to the recent transactions method, 3 to the DCF estimate, and .2 to the comparable companies' estimate. What it weighted average estimate she gives to the CEO? Show your work.
(Essay)
4.9/5 (33)
Liquidation or breakup value is the projected price of the firm's assets sold separately in liquidating or breaking up the firm.
(True/False)
4.8/5 (43)
Is Texas Instruments Overpaying for National Semiconductor? As Always, It depends.
Valuation is far more an art than a science, and understanding the limitations of individual valuation methods is critical.
Averaging multiple valuation methods is often the most reliable means of valuing a firm.
Evaluating success of an individual acquisition is best viewed in the context of an acquirer’s overall business strategy.
Value is in the eye of the beholder. Various indicators often provide a wide range of estimates. No single method seems to provide consistently accurate valuation estimates. Which method the analyst ultimately selects often depends on the availability of data and on the analyst’s own biases. Whether a specific acquisition should be viewed as successful depends on the extent to which it helps the acquirer realize a successful business strategy.
At $25 per share in cash, Texas Instruments (TI) announced on March 5, 2011, that it had reached an agreement to acquire National Semiconductor (NS). The resulting 78% premium over NS’s closing share price the day prior to the announcement raised eyebrows. After showing little activity in the days immediately prior to the announcement, NS’s share price soared by 71% and TI’s share price rose by 2.25% immediately following the announcement. While it is normal for the target’s share price to rise sharply to reflect the magnitude of the premium, the acquirer’s share price sometimes remains unchanged or even declines. The increase in TI’s share price seems to suggest agreement among investors that the acquisition made sense. However, within days, analysts began to ask the question that bedevils so many takeovers. Did Texas Instruments overpay for National Semiconductor?
Whether TI overpaid depends on how you measure value and how you interpret the results. Looking at recent semiconductor industry transactions, the magnitude of the premium is almost twice the average paid on 196 acquisitions in the semiconductor industry during the last several years. Based on price-to-earnings ratio analysis, TI paid 19.1 times NS’s 2012 estimated earnings, as compared to 14.3 times industry average earnings for the same year. This implied that TI was willing to pay $19.10 per share for each dollar of the next year’s earnings per NS share. In contrast, investors were generally willing to pay on average on $14.30 for each dollar of 2012 earnings for the average firm in the semiconductor industry. Using a ratio of market capitalization (market price) to sales, it also appears that TI’s premium is excessive. TI paid four times NS’s current annual sales, well above other key competitors. such as Maxim Integrated Products and Intersil, which traded at 3.2 and 1.8 times sales, respectively.
The enterprise-value-to-sales ratio compares the value of a firm to its revenue and gives investors an idea of how much it costs to buy the company’s sales. Some analysts believe that it is a more useful indicator than a market-capitalization-to-sales ratio, which considers only how equity investors value each dollar of sales, since the market-cap-to-sales ratio ignores that the firm’s current debt must be repaid. By this measure, TI is willing to pay $4.40 for each dollar of revenue, as compared to $3.80 per dollar of sales for the average semiconductor firm. Another useful valuation ratio, the price-to-earnings ratio divided by the earnings growth rate (PEG ratio), also suggested that TI might have overpaid. The PEG ratio relates what investors are willing to pay for a firm per dollar of earnings to the growth rate of earnings. At 1.28 prior to the TI takeover, NS was trading at a premium to its growth rate according to this measure. After the acquisition, the PEG ratio jumped to 2.09.
While suggesting strongly that TI overpaid, these measures may be seriously biased. A large percentage of TI’s and NS’s revenue comes from the production and sale of analog chips, a rapidly growing segment of the semiconductor industry. Part of the growth in analog chips is expected to come from the explosive growth of smartphones and tablets, where their use in regulating electricity consumption is crucial to longer battery life. Consequently, many of the previous acquisitions in the semiconductor industry are of firms that do not compete in the analog chip market; as such, they are not entirely comparable. Moreover, many of these acquisitions came amidst a sluggish economic recovery and were made at “fire-sale” prices.
With the exception of comparisons with recent comparable transactions, all of these valuation measures do not consider directly the value of synergy. There was little overlap between TI’s and NS’s product offering. TI believes that they can increase substantially NS’s sales by selling their products through TI’s much larger sales force. Furthermore, TI added 12,000 new analog chip products, bringing its combined offering to more than 30,000 products. TI also gets access to a number of analog engineers, who are highly specialized and relatively rare. Finally, in the highly fragmented semiconductor industry, consolidation among competitors may lead to higher average selling prices than would have been realized otherwise.
The acquisition of NS by TI should be viewed in the context of a longer-term strategy in which TI is seeking an ever-increasing share of the $42 billion analog chip market, which many analysts expect to outgrow the overall semiconductor market during the next three to five years. Following the financial crisis in 2008, TI acquired analog chip manufacturing facilities at “fire-sale” prices to boost the firm’s capacity. The NS acquisition will give TI a 17% share of this rapidly growing market segment.
-Dou you agree or disagree with the following statement: Valuation is more an art than a science.
(Essay)
4.9/5 (38)
Tangible book value is the value of shareholders' equity less net fixed assets.
(True/False)
4.9/5 (29)
Best's Foods is seeking to acquire the Heinz Baking Company, whose shareholders equity and goodwill are $41 million and $7 million, respectively. A comparable bakery was recently acquired for $400 million, 30 percent more than its tangible book value (TBV). What was the tangible book value of the recently acquired bakery? How much should Best's Foods expect to have to pay for the Heinz Baking Company? Show your work.
(Essay)
4.8/5 (36)
All of the following are true for market based valuation methods except for which of the following?
(Multiple Choice)
4.7/5 (37)
Bristol-Myers Squibb Places a Big Bet on Inhibitex
DCF valuation assumes implicitly that management has little decision-making flexibility once an investment decision is made.
In practice, management may accelerate, delay, or abandon the original investment as new information is obtained.
______________________________________________________________________________________________________________
Pharmaceutical firms in the United States are facing major revenue declines during the next several years because of patent expirations for many drugs that account for a substantial portion of their annual revenue. The loss of patent protection will enable generic drug makers to sell similar drugs at much lower prices, thereby depressing selling prices for such drugs across the industry. In response, major pharmaceutical firms are inclined to buy smaller drug development companies whose research and developments efforts show promise in order to offset the expected decline in their future revenues as some “blockbuster” drugs lose patent protection.
Aware that its top-selling blood thinner, Plavix, would lose patent protection in May 2012, Bristol-Myers Squibb (Bristol-Myers) moved aggressively to shed its infant formula and other noncore businesses to focus on pharmaceuticals. Such restructuring has reduced employment from 40,000 in 2008 to 26,000 in 2011. Bristol-Myers’ strategy has been either to acquire firms with promising drugs under development or to develop them internally. However, the firm faced an uphill struggle to offset the potential loss of $6.7 billion in annual Plavix revenue, which represented about one-third of the firm’s total annual revenue.
In early January 2012, Bristol-Myers announced that it had reached an agreement to purchase hepatitis C drug developer Inhibitex Inc. for $2.5 billion. Inhibitex focuses on treatments for bacterial and viral infections. It had annual revenue of only $1.9 million and an operating loss of $22.7 million in 2011. The lofty purchase price reflected Bristol-Myers’ growth expectations for the firm’s hepatitis C treatment INX-189, based on very early phase one clinical testing trials, with larger trials scheduled for 2013. The all-cash deal for $26 per share represented a 164% premium to Inhibitex’s closing price on January 10, 2012.
Bristol-Myers valued Inhibitex in terms of the expected cash flows resulting from the commercialization of hepatitis C treatment INX-189. Standard discounted cash flow analysis assumes implicitly that once Bristol-Myers makes an investment decision, it cannot change its mind. In reality, management has a series of so-called real options enabling them to make changes to their original investment decision contingent on certain future developments.
These options include the decision to expand (i.e., accelerate investment at a later date), delay the initial investment, or abandon an investment. With respect to Bristol-Myers’ acquisition of Inhibitex, the major uncertainties deal with the actual timing and amount of the projected cash flows. In practice, Bristol-Myers’ management could expand or accelerate investment in the new Inhibitex drug, contingent on the results of subsequent trials. The firm could also delay additional investment until more promising results are obtained. Finally, if the test results suggest that the firm is not likely to realize the originally anticipated developments, it could abandon or exit the business by spinning-off or divesting Inhibitex or by shutting it down. The bottom line is that management has considerably greater decision-making flexibility than is implicit in traditional discounted cash flow analysis.
Google Buys YouTube: Valuing a Firm Without Cash Flows
YouTube ranks as one of the most heavily utilized sites on the Internet, with one billion views per day, 20 hours of new video uploaded every minute, and 300 million users worldwide. Despite the explosion in usage, Google continues to struggle to “monetize” the traffic on the site five years after having acquired the video sharing business. 2010 marked the first time the business turned marginally profitable. Whether the transaction is viewed as successful depends on whether it is evaluated on a stand-alone basis or as part of a larger strategy designed to steer additional traffic to Google sites and promote the brand.
This case study illustrates how a value driver approach to valuation could have been used by Google to estimate the potential value of YouTube by collecting publicly available data for a comparable business. Note the importance of clearly identifying key assumptions underlying the valuation. The credibility of the valuation ultimately depends on the credibility of the assumptions.
Google acquired YouTube in late 2006 for $1.65 billion in stock. At that time, the business had been in existence only for 14 months, consisted of 65 employees, and had no significant revenues. However, what it lacked in size it made up in global recognition and a rapidly escalating number of site visitors. Under pressure to continue to fuel its own meteoric 77 percent annual revenue growth rate, Google moved aggressively to acquire YouTube in an attempt to assume center stage in the rapidly growing online video market. With no debt, $9 billion in cash, and a net profit margin of about 25 percent, Google was in remarkable financial health for a firm growing so rapidly. The acquisition was by far the most expensive acquisition by Google in its relatively short eight-year history. In 2005, Google spent $130.5 million in acquiring 15 small firms. Google seemed to be placing a big bet that YouTube would become a huge marketing hub as its increasing number of viewers attracts advertisers interested in moving from television to the Internet.
Started in February 2005 in the garage of one of the founders, YouTube displayed in 2006 more than 100 million videos daily and had an estimated 72 million visitors from around the world each month, of which 34 million were unique. As part of Google, YouTube retained its name and current headquarters in San Bruno, California. In addition to receiving funding from Google, YouTube was able to tap into Google's substantial technological and advertising expertise.
To determine if Google would be likely to earn its cost of equity on its investment in YouTube, we have to establish a base-year free cash-flow estimate for YouTube. This may be done by examining the performance of a similar but more mature website, such as about.com. Acquired by The New York Times in February 2005 for $410 million, about.com is a website offering consumer information and advice and is believed to be one of the biggest and most profitable websites on the Internet, with estimated 2006 revenues of almost $100 million. With a monthly average number of unique visitors worldwide of 42.6 million, about.com's revenue per unique visitor was estimated to be about $0.15, based on monthly revenues of $6.4 million.
By assuming these numbers could be duplicated by YouTube within the first full year of ownership by Google, YouTube could potentially achieve monthly revenue of $5.1 million (i.e., $0.15 per unique visitor × 34 million unique YouTube visitors) by the end of year. Assuming net profit margins comparable to Google's 25 percent, YouTube could generate about $1.28 million in after-tax profits on those sales. If that monthly level of sales and profits could be sustained for the full year, YouTube could achieve annual sales in the second year of $61.2 million (i.e., $5.1 × 12) and profit of $15.4 million ($1.28 × 12). Assuming optimistically that capital spending and depreciation grow at the same rate and that the annual change in working capital is minimal, YouTube's free cash flow would equal after-tax profits.
Recall that a firm earns its cost of equity on an investment whenever the net present value of the investment is zero. Assuming a risk-free rate of return of 5.5 percent, a beta of 0.82 (per Yahoo! Finance), and an equity premium of 5.5 percent, Google's cost of equity would be 10 percent. For Google to earn its cost of equity on its investment in YouTube, YouTube would have to generate future cash flows whose present value would be at least $1.65 billion (i.e., equal to its purchase price). To achieve this result, YouTube's free cash flow to equity would have to grow at a compound annual average growth rate of 225 percent for the next 15 years, and then 5 percent per year thereafter. Note that the present value of the cash flows during the initial 15-year period would be $605 million and the present value of the terminal period cash flows would be $1,005 million. Using a higher revenue per unique visitor assumption would result in a slower required annual growth rate in cash flows to earn the 10 percent cost of equity. However, a higher discount rate might be appropriate to reflect YouTube's higher investment risk. Using a higher discount rate would require revenue growth to be even faster to achieve an NPV equal to zero.
Google could easily have paid cash, assuming that the YouTube owners would prefer cash to Google stock. Perhaps Google saw its stock as overvalued and decided to use it now to minimize the number of new shares that it would have had to issue to acquire YouTube, or perhaps YouTube shareholders simply viewed Google stock as more attractive than cash.
With YouTube having achieved marginal profitability in 2010, it would appear that the valuation assumptions implicit in Google's initial valuation of YouTube may, indeed, have been highly optimistic. While YouTube continues to be wildly successful in terms of the number of site visits, with unique monthly visits having increased almost six fold from their 2006 level, it appears to be disappointing at this juncture in terms of profitability and cash flow. The traffic continues to grow as a result of integration with social networks such as Facebook and initiatives such as the ability to send clips to friends as well as to rate and comment on videos. Moreover, YouTube is showing some progress in improving profitability by continuing to expand its index of professionally produced premium content. Nevertheless, on a stand-alone basis, it is problematic that YouTube will earn Google’s cost of equity. However, as part of a broader Google strategy involving multiple acquisitions to attract additional traffic to Google and to promote the brand, the purchase may indeed make sense.
-The purchase price paid for YouTube represented more than one percent of Google's then market value. If you were a Google
shareholder, how might you have evaluated the wisdom of the acquisition?
(Essay)
4.8/5 (34)
Which is generally considered more accurate: the comparable companies' or recent comparable transactions method?
(Essay)
4.9/5 (36)
Intangible assets often constitute a substantial source of value to the acquiring firm. Which of the following are not generally considered intangible assets?
(Multiple Choice)
4.8/5 (30)
Empirical evidence suggests that forecasts of earnings and other value indicators are better predictors of firm value than value indicators based on historical data.
(True/False)
4.9/5 (31)
Explain the primary differences between the income (discounted cash flow), relative (market-based), and asset-oriented valuation methods?
(Essay)
4.8/5 (38)
Under what circumstances might it be more appropriate to use relative valuation methods rather than the DCF approach? Be specific.
(Essay)
4.9/5 (32)
What are the key assumptions implicit in the comparable companies' valuation method? The recent transactions method? Be specific.
(Essay)
4.9/5 (35)
Valuation Methods Employed in Investment Bank Fairness Opinion Letters
Background
A fairness opinion letter is a written third-party certification of the appropriateness of the price of a proposed transaction such as a merger, acquisition, leveraged buyout, or tender offer. A typical fairness opinion provides a range of what is believed to be fair values, with a presumption that the actual deal price should fall within this range. The data used in this case study is found in SunGard’s Schedule 14A Proxy Statement submitted to the SEC in May 2005.
On March 27, 2005, the investment banking behemoth Lazard Freres (Lazard) submitted a letter to the board of directors of SunGard Corporation pertaining to the fairness of a $10.9 billion bid to take the firm private made by an investor group. Lazard employed a variety of valuation methods to evaluate the offer price. These included the comparable company approach, the recent transactions method, discounted cash flow analysis, and an analysis of recent transaction premiums. The analyses were applied to each of the firm’s major businesses: software services and recovery availability services. The software services’ business provides software systems and support for application and transaction processing to financial services firms, universities, and government agencies. The recovery availability services business provides businesses and government agencies with backup and recovery support in the event their data processing systems are disrupted.
Comparable Company Analysis
Using publicly available information, Lazard reviewed the market values and trading multiples of the selected publicly held companies for each business segment. Multiples were based on stock prices as of March 24, 2005 and specific company financial data on publicly available research analysts’ estimates for 2005. In the case of SunGard’s software business, Lazard reviewed the market values and trading multiples of four publicly traded financial services companies and three publicly traded securities trading companies. In the case of SunGard’s recovery availability services business, Lazard reviewed the market values and trading multiples of the six selected publicly traded business continuity services (i.e., recoverability services firms) companies. These firms were believed to be representative of these segments of SunGard’s operations.
Lazard calculated enterprise values for these comparable companies as equity value plus debt, preferred stock, and all out-of-the-money convertibles (i.e., convertible debt whose conversion price exceeded the merger offer price), less cash and cash equivalents (i.e., short-term liquid securities). Estimated enterprise value multiples of earnings before interest, taxes, depreciation and amortization (i.e., EBITDA) were created for 2005 by dividing enterprise values by publicly available estimates of EBITDA for each comparable company. Similarly, price-to-earnings ratios were created by dividing equity values per share by earnings per share for each comparable company for calendar 2005. See Tables 8-1 and 8.2.
Enterprise Value as a Multiple of EBITDA Price-to-Earnings Multiple (P/E) 2005 2005 High 9.0 38.1 Mean 6.7 18.2 Median 6.5 15.3 Low 3.8 12.6 = estimate.
Based on this analysis, Lazard determined an enterprise value to estimated 2005 EBITDA multiple range for SunGard’s recovery availability services business of 5.5x to 7.0x. Lazard also determined a 2005 estimated P/E range for this segment of 14.0x to 16.0x. Multiplying SunGard’s projected EBITDA and earnings per share for 2005 by these ranges, Lazard calculated an enterprise value range for SunGard’s recovery availability services business of approximately $3.1 billion to $3.7 billion. Financial projections for SunGard were provided by SunGard’s management.
Table 8-2. Enterprise Value Multiples for Comparable Software Companies Enterprise Value as a Multiple of EBITDA Price-to-Earnings Multiple (/) High 13.8 21.5 Mean 9.7 18.8 Median 9.0 18.1 Low 7.3 16.9
Based on the results in Table 8-2, Lazard determined an enterprise value to estimated 2005 EBITDA multiple range for SunGard’s software business of 7.5x to 9.5x. Lazard also determined a 2005 estimated P/E range for SunGard’s software business of 17.0 to 19.0x. Multiplying SunGard’s projected EBITDA and earnings per share for 2005 by these ranges, Lazard calculated an enterprise value range for SunGard’s software business of approximately $4.3 billion to $5.2 billion.
Lazard then summed the enterprise value ranges for SunGard’s software business and recovery availability services business to calculate a consolidated enterprise value range for SunGard of approximately $7.4 billion to $8.9 billion. Using this consolidated enterprise value range and assuming net debt (i.e., total debt less cash and cash equivalents on the balance sheet) of $273 million, Lazard calculated an implied price per share range for SunGard common stock of $24.20 to $29.00 by dividing the enterprise value less net debt by the SunGard shares outstanding.
Recent Transactions Method
For the recovery availability services business, Lazard reviewed ten merger and acquisition transactions since October 2001 for companies in the information technology outsourcing business. To the extent publicly available, Lazard reviewed the transaction enterprise values of the recent transactions as a multiple of the last twelve months EBITDA for the period ending on the recent transaction announcement date. See Table 8-3.
High 10.8 Mean 7.37 Median 6.4 Low 5.4
Based on Table 8-3, Lazard determined an EBITDA multiple range of 6.5x to 7.5x and multiplied this range by the last twelve months EBITDA for SunGard’s recovery availability business to calculate an implied enterprise value range of approximately $3.4 billion to $4.0 billion.
Lazard reviewed 21 merger and acquisition transactions since February 2003 with a value greater than approximately $100 million for companies in the software business. To the extent publicly available, Lazard examined the transaction enterprise values of the recent transactions as a multiple of EBITDA for the last twelve months prior to the public announcement of the relevant recent transaction. See Table 8-4.
High 11.6 Mean 9.8 Median 9.9 Low 6.8
Based on the information contained in Table 8-5, Lazard determined an EBITDA multiple range of 9.0x to 11.0x and multiplied this range by the last twelve month EBITDA for SunGard’s software business to calculate an implied enterprise value range for this business segment of approximately $5.0 billion to $6.1 billion.
Lazard then summed the enterprise value ranges for SunGard’s software business and recovery availability services business to calculate a consolidated enterprise value range for SunGard of approximately $8.4 billion to $10.1 billion. Using this consolidated enterprise value range and assuming net debt of $273 million, Lazard calculated the value per share of SunGard common stock of $27.60 to $32.70 by dividing the estimated consolidated enterprise value less net debt by common shares outstanding.
Discounted Cash Flow Analysis
Using projections provided by SunGard’s management, Lazard performed an analysis of the present value, as of March 31, 2005, of the free cash flows that SunGard could generate annually from calendar year 2005 through calendar year 2009. Lazard analyzed separately the cash flows for SunGard’s software business and recovery availability services business.
For SunGard’s software business, in calculating the terminal value, Lazard assumed perpetual growth rates (i.e., constant growth model) of 3.5% to 4.5% for the projected free cash flows for the periods subsequent to 2009. The projected annual cash flows through 2009 and beyond were then discounted to present value using discount rates ranging from 10.0% to 12.0%. Based on this analysis, Lazard calculated an implied enterprise value range for the software business of approximately $5.6 billion to $7.4 billion.
For SunGard’s recovery availability services business, in calculating the terminal value Lazard assumed perpetual growth rates of 2.0% to 3.0% for the projected free cash flows for periods subsequent to 2009. The projected cash flows were then discounted to present value using discount rates ranging from 10.0% to 12.0%. Lazard then calculated an implied enterprise value range for SunGard’s recovery availability business of approximately $2.6 billion to $3.3 billion.
Lazard then aggregated the enterprise value ranges for SunGard’s two business segments to calculate a consolidated enterprise value range for SunGard of approximately $8.2 billion to $10.7 billion. Using this consolidated enterprise value range and assuming net debt of $273 million, Lazard calculated an implied price per share range for SunGard common stock of $26.70 to $34.60.
Premiums Paid Analysis
Lazard performed a premiums paid analysis based upon the premiums paid in 73 recent transactions (not involving “mergers of equals” transactions) that were announced from January 2004 through March 2005 and involved transaction values in excess of $1 billion. In conducting its analysis, Lazard analyzed the premiums paid for recent transactions over $1 billion and those over $5 billion, since premiums paid may vary with the size of the transaction.
The analysis was based on the one day, one week and four week implied premiums for the transactions examined. The implied premiums were calculated by comparing the offer price for the target firm on the announcement date with the per share price of the target firm one day, one week, and four weeks prior to the announcement of the transaction. The results of these calculations are given in Table 8-5.
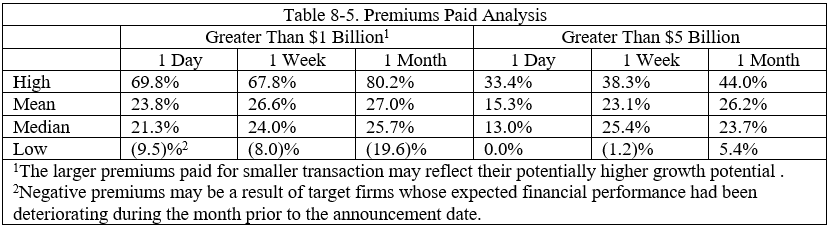 Based on this analysis, Lazard determined an applicable premium range of 20% to 30% for SunGard and applied this range to SunGard’s share price of $24.95 on March 18, 2005. Using this information, Lazard calculated an implied price per share range for SunGard common stock of $29.94 (i.e., 1.2 x $24.95) to $32.44 (1.3 x $24.95).
Summary and Conclusions
Table 8-6 summarizes the estimated valuation ranges based on the alternative valuation methods employed by Lazard Freres. Note that the $36 per offer price compares favorably to the estimated average valuation range, representing a premium of 12% (i.e., $36/$27.11) to 33% (i.e., $36/$32.19). Consequently, Lazard Freres viewed the investor group’s offer price for SunGard as fair.
Table 8-6. Valuation Range Summary Valuation Method Valuation Range ( \/ Common Share) (Max. Valuation less Min. Valuation)/Min. Valuation Comparable Companies 24.20-29.00 19.8\% Recent Transactions 27.60-32.70 18.5\% Discounted Cash Flow 26.70-34.60 29.6\% Premiums Paid 29.94-32.44 8.4\% Average 27.11-32.19 18.7\%
-Discuss the strengths and weaknesses of each valuation method employed by these investment banks in constructing estimates of SunGard's value for the Fairness Opinion Letter. Be specific.
Based on this analysis, Lazard determined an applicable premium range of 20% to 30% for SunGard and applied this range to SunGard’s share price of $24.95 on March 18, 2005. Using this information, Lazard calculated an implied price per share range for SunGard common stock of $29.94 (i.e., 1.2 x $24.95) to $32.44 (1.3 x $24.95).
Summary and Conclusions
Table 8-6 summarizes the estimated valuation ranges based on the alternative valuation methods employed by Lazard Freres. Note that the $36 per offer price compares favorably to the estimated average valuation range, representing a premium of 12% (i.e., $36/$27.11) to 33% (i.e., $36/$32.19). Consequently, Lazard Freres viewed the investor group’s offer price for SunGard as fair.
Table 8-6. Valuation Range Summary Valuation Method Valuation Range ( \/ Common Share) (Max. Valuation less Min. Valuation)/Min. Valuation Comparable Companies 24.20-29.00 19.8\% Recent Transactions 27.60-32.70 18.5\% Discounted Cash Flow 26.70-34.60 29.6\% Premiums Paid 29.94-32.44 8.4\% Average 27.11-32.19 18.7\%
-Discuss the strengths and weaknesses of each valuation method employed by these investment banks in constructing estimates of SunGard's value for the Fairness Opinion Letter. Be specific.
(Essay)
4.7/5 (39)
Market-based valuation measures are meaningful only for firms with a stable earnings, cash flow, or sales history.
(True/False)
4.8/5 (46)
The enterprise to EBITDA method of valuation can be compared more readily among firms exhibiting different levels of leverage than for other measures of earnings, since the numerator represents the total value of the firm and the denominator measures earnings before interest.
(True/False)
4.9/5 (36)
The analyst should be careful not to mechanically add an acquisition premium to the target firm's estimated value based on the comparable companies' method if there is evidence that the market values of these "comparable firms" already reflect the effects of acquisition activity elsewhere in the industry.
(True/False)
4.7/5 (39)
Filters
- Essay(0)
- Multiple Choice(0)
- Short Answer(0)
- True False(0)
- Matching(0)