Exam 1: Linear Equations and Graphs
Exam 1: Linear Equations and Graphs50 Questions
Exam 3: Mathematics of Finance95 Questions
Exam 5: Linear Inequalities and Linear Programming28 Questions
Exam 7: Logic, sets, and Counting70 Questions
Exam 8: Probability65 Questions
Exam 9: Markov Chains58 Questions
Exam 10: Limits and the Derivative37 Questions
Exam 11: Mathematical Functions and Limits58 Questions
Select questions type
Use the REGRESSION feature on a graphing calculator.
-In the table below,x represents the number of years since 2000 and y represents sales (in thousands of dollars)of a clothing company.Use the regression equation to estimate sales in the year 2006.Round to the nearest thousand dollars. 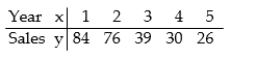
(Multiple Choice)
4.7/5  (37)
(37)
Solve the inequality and graph. Express your answer in interval notation.
-7x - 3 > 6x - 6
(Multiple Choice)
5.0/5 (37)
Use the REGRESSION feature on a graphing calculator.
-The paired data below consists of the temperature on randomly chosen days and the amount of a certain kind of plant grew (in millimeters). 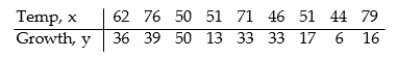 Find the linear function that predicts a plant's growth as a function of the temperature.Round your answer to two decimal places.
(Multiple Choice)
4.9/5 (34)
Use the REGRESSION feature on a graphing calculator.
-The use of bottled water in the United States has shown a steady increase in recent years.The table shows the annual per capita consumption for the years 1995 - 2001. 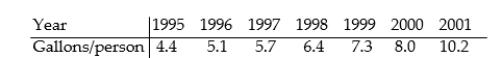 With x being the years since 1995,find the linear function that represents this data.Round your answer to two decimal places.
(Multiple Choice)
4.9/5 (42)
Solve the inequality and graph. Express your answer in interval notation.
--23 c -4x - 3 c -19 
(Multiple Choice)
4.8/5 (34)
Provide an appropriate response.
-Use the graph to find the slope-intercept form of the equation of the line. 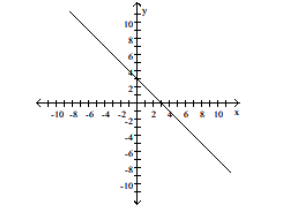
(Multiple Choice)
4.9/5 (31)
Find the slope and y intercept of the graph of the equation.
-y = -4x + 6
(Multiple Choice)
4.9/5 (39)
Solve the problem.
-Find the Celsius temperature (to the nearest degree)when Fahrenheit temperature is 95° by solving the equation 95 =  C + 32,where F is the Fahrenheit temperature (in degrees)and C is the Celsius temperature.
(Multiple Choice)
4.7/5 (34)
Find the slope and y intercept of the graph of the equation.
-y = 3x - 6
(Multiple Choice)
4.8/5 (38)
Filters
- Essay(0)
- Multiple Choice(0)
- Short Answer(0)
- True False(0)
- Matching(0)