Exam 8: Time Series Analysis and Forecasting
Exam 1: Introduction35 Questions
Exam 2: Descriptive Statistics65 Questions
Exam 3: Data Visualization47 Questions
Exam 4: Descriptive Data Mining44 Questions
Exam 5: Probability: an Introduction to Modeling Uncertainty36 Questions
Exam 6: Statistical Inference47 Questions
Exam 7: Linear Regression46 Questions
Exam 8: Time Series Analysis and Forecasting41 Questions
Exam 9: Predictive Data Mining38 Questions
Exam 10: Spreadsheet Models49 Questions
Exam 11: Monte Carlo Simulation41 Questions
Exam 12: Linear Optimization Models38 Questions
Exam 13: Integer Linear Optimization Models42 Questions
Exam 14: Nonlinear Optimization Models46 Questions
Exam 15: Decision Analysis40 Questions
Select questions type
A time series plot of a period of time (in years) versus revenue (in millions of dollars) is shown below. Which of the following data patterns best describes the scenario shown? 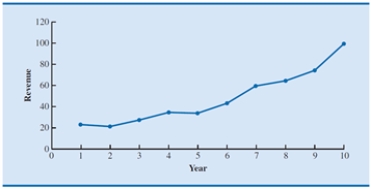
Free
(Multiple Choice)
5.0/5  (39)
(39)
Correct Answer: Verified
B
A time series plot of a period of time (in months) versus sales (in number of units) is shown below. Which of the following data patterns best describes the scenario shown? 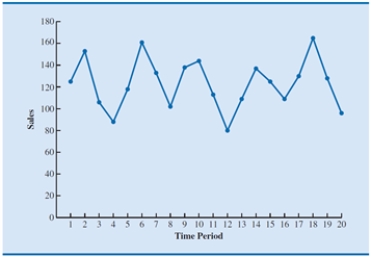
Free
(Multiple Choice)
4.8/5 (44)
Correct Answer:Verified
D
A set of observations on a variable measured at successive points in time or over successive periods of time constitute a
Free
(Multiple Choice)
4.7/5 (38)
Correct Answer:Verified
C
For causal modeling, __________ are used to detect linear or nonlinear relationships between the independent and dependent variables.
(Multiple Choice)
5.0/5 (42)
Demand for a product and the forecasting department's forecast (naïve model) for a product are shown below. Compute the mean absolute error. ? Period Actual Demand Forecasted Demand 1 12 -- 2 15 12 3 14 15 4 18 16
(Multiple Choice)
4.7/5 (35)
__________ is the amount by which the predicted value differs from the observed value of the time series variable.
(Multiple Choice)
4.9/5 (33)
With reference to time series data patterns, a cyclical pattern is the component of the time series that
(Multiple Choice)
4.8/5 (28)
The value of an independent variable from the prior period is referred to as a
(Multiple Choice)
4.9/5 (32)
Which of the following is true of the exponential smoothing coefficient?
(Multiple Choice)
4.9/5 (31)
What is the difference between a stationary time series and a time series that shows a trend pattern?
(Essay)
4.9/5 (27)
A time series plot of a period of time (in years) versus sales (in thousands of dollars) is shown below. Which of the following data patterns best describes the scenario shown? 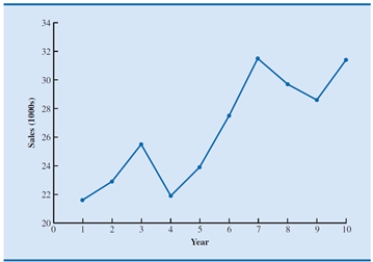
(Multiple Choice)
4.8/5 (33)
What is the difference between moving averages and exponential smoothing?
(Essay)
4.8/5 (40)
If the forecasted value of the time series variable for period 2 is 22.5 and the actual value observed for period 2 is 25, what is the forecast error in period 2?
(Multiple Choice)
4.8/5 (43)
Filters
- Essay(0)
- Multiple Choice(0)
- Short Answer(0)
- True False(0)
- Matching(0)