Exam 14: Nonlinear Optimization Models
Exam 1: Introduction35 Questions
Exam 2: Descriptive Statistics65 Questions
Exam 3: Data Visualization47 Questions
Exam 4: Descriptive Data Mining44 Questions
Exam 5: Probability: an Introduction to Modeling Uncertainty36 Questions
Exam 6: Statistical Inference47 Questions
Exam 7: Linear Regression46 Questions
Exam 8: Time Series Analysis and Forecasting41 Questions
Exam 9: Predictive Data Mining38 Questions
Exam 10: Spreadsheet Models49 Questions
Exam 11: Monte Carlo Simulation41 Questions
Exam 12: Linear Optimization Models38 Questions
Exam 13: Integer Linear Optimization Models42 Questions
Exam 14: Nonlinear Optimization Models46 Questions
Exam 15: Decision Analysis40 Questions
Select questions type
Using the graph below, the feasible region for the function represented in the graph is 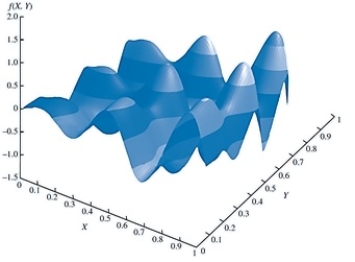
(Multiple Choice)
4.8/5  (32)
(32)
A function that is bowl-shaped down is called a __________ function.
(Multiple Choice)
4.8/5 (35)
A(n) __________ is a set of points defining the minimum possible risk for a set of return values.
(Multiple Choice)
4.8/5 (39)
Which of the following functions yields the shape shown below? 
(Multiple Choice)
4.8/5 (30)
A portfolio optimization model used to construct a portfolio that minimizes risk subject to a constraint requiring a minimum level of return is known as
(Multiple Choice)
4.8/5 (44)
The measure of risk most often associated with the Markowitz portfolio model is the
(Multiple Choice)
4.8/5 (29)
In reviewing the image below, what is the minimum value for this function? 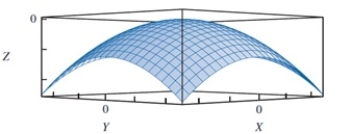
(Multiple Choice)
4.8/5 (38)
The reduced gradient is analogous to the __________ for linear models.
(Multiple Choice)
4.7/5 (37)
If all the squared terms in a quadratic function have a negative coefficient and there are no cross-product terms, then the function is a __________ function.
(Multiple Choice)
4.8/5 (34)
In the Bass forecasting model, the ___________ measures the likelihood of adoption, assuming no influence from someone who has already purchased (adopted) the product.
(Multiple Choice)
4.9/5 (39)
If a minimization problem has a single global optimum, will it have a local minimum? If yes, can it have more than one local minimum? Explain.
(Essay)
4.7/5 (47)
A feasible solution is a(n) __________ if there are no other feasible solutions with a better objective function value in the immediate neighborhood.
(Multiple Choice)
4.9/5 (32)
One of the ways to use the Bass forecasting model is to wait until several periods of data for the problem under consideration are available. This is known as the ___________ approach.
(Multiple Choice)
4.8/5 (34)
If an optimization objective function produces a graph that is concave, will the global optimum be a maximum or minimum value? Explain.
(Essay)
4.8/5 (37)
In reviewing the image below, the point (0, 0, 0) is a(n) __________ for the given concave function. 
(Multiple Choice)
4.7/5 (36)
A feasible solution is __________ if there are no other feasible points with a smaller objective function value in the entire feasible region.
(Multiple Choice)
4.8/5 (30)
Which of the following conclusions can be drawn from the below figure using the Bass forecasting model? (Note: Bass forecasting model is given by: Ft = (p + q[Ct - 1 /m]) (m - Ct - 1)
Where m = the number of people estimated to eventually adopt the new product,
Ct - 1 = the number of people who have adopted the product through time t - 1,
Q = the coefficient of imitation, and
P = the coefficient of innovation. ![Which of the following conclusions can be drawn from the below figure using the Bass forecasting model? (Note: Bass forecasting model is given by: F<sub>t</sub> = (p + q[Ct<sub> - 1</sub> /m]) (m - Ct<sub> - 1</sub>) Where m = the number of people estimated to eventually adopt the new product, Ct<sub> - 1</sub> = the number of people who have adopted the product through time t - 1, Q = the coefficient of imitation, and P = the coefficient of innovation.](https://storage.examlex.com/TB1188/11eb0d2f_b222_0580_9790_7366b4e30ad4_TB1188_00.jpg)
(Multiple Choice)
4.8/5 (35)
A nonlinear function with at least one term raised to the power of two is known as a
(Multiple Choice)
4.8/5 (31)
Filters
- Essay(0)
- Multiple Choice(0)
- Short Answer(0)
- True False(0)
- Matching(0)