Exam 6: The Standard Deviation As a Ruler and the Normal Model
Exam 1: Stats Start Here115 Questions
Exam 2: Data150 Questions
Exam 3: Displaying and Describing Categorical Data110 Questions
Exam 4: Displaying and Comparing Qualitative Data84 Questions
Exam 5: Understanding and Comparing Distributions103 Questions
Exam 6: The Standard Deviation As a Ruler and the Normal Model74 Questions
Exam 7: Scatterplots, Association, and Correlation40 Questions
Select questions type
At one vehicle inspection station, 13 of 52 trucks and 11 of 88 cars failed the emissions test.Assuming these vehicles were representative of the cars and trucks in that area, what is theStandard error of the difference in the percentages of all cars and trucks that are not in compliance with air quality regulations?
(Multiple Choice)
4.7/5  (30)
(30)
An elementary school principal wants to know the mean number of children in families whose children attend this school. He checks all the families using the school's registration records, and we use the computer to create a 95% confidence interval based on a t-distribution. This procedure was not appropriate. Why?
(Multiple Choice)
4.9/5 (37)
A random sample of 120 classrooms at a large university found that 70% of them had been cleaned properly. What is the standard error of the sample proportion?
(Multiple Choice)
4.8/5 (24)
A random sample of 13 men and 19 women in a college class reported their grade point averages (GPAs). Here are histograms from the data:
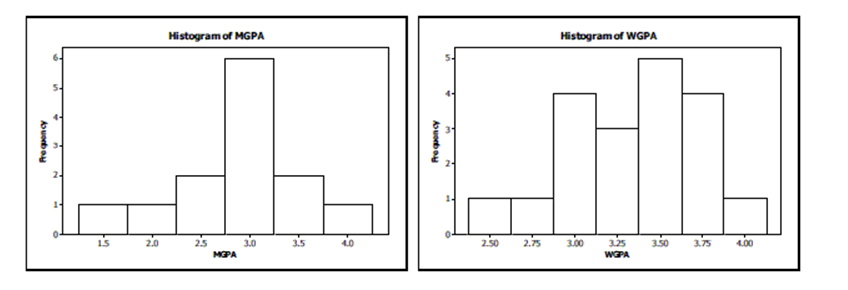 Summary statistics for these data are:
s Men 2.898 0.583 Women 3.330 0.395
-A woman in the class says that she believes that college women tend to have higher GPAs than do college men. Does this sample support her claim? Test an appropriate hypothesis and state your conclusion.
Summary statistics for these data are:
s Men 2.898 0.583 Women 3.330 0.395
-A woman in the class says that she believes that college women tend to have higher GPAs than do college men. Does this sample support her claim? Test an appropriate hypothesis and state your conclusion.
(Essay)
5.0/5 (35)
A wildlife biologist wants to determine the mean weight of adult red squirrels. She captures 10 squirrels she believes to be representative of the species and weighs them, finding a mean of 12.32 grams and standard deviation of 1.88 gm. Assuming these squirrels can be considered a random sample of all red squirrels which of the following formulas gives a 95% confidence interval for the mean weight of all squirrels?
(Multiple Choice)
4.9/5 (37)
A marketing company reviewing the length of television commercials monitored a random sample of commercials over several days. They found that a 95% confidence interval for the mean length (in seconds) of commercials aired daily was (23, 27). Which is true?
(Multiple Choice)
4.9/5 (38)
Graduation tests Many states mandate tests that have to be passed in order for the students to graduate with a high school diploma. A local school superintendent believes that after-school tutoring will improve the scores of students in his district on the state's graduation test. A tutor agrees to work with 15 students for a month before the superintendent will approach the school board about implementing an after-school tutoring program. The after-school tutoring program will be implemented if student
scores increase by more than 20 points. The superintendent will test a hypothesis using a =
0.02 .
a. Write appropriate hypotheses (in words and in symbols).
b. In this context, which do you consider to be more serious - a Type I or a Type II error? Explain.
c. After this trial produced inconclusive results, the superintendent decided to test the
after-school tutoring program again with another group of students. Describe two changes he could make in the trial to increase the power of the test, and explain the disadvantages of each.
(Essay)
4.8/5 (31)
Which statement correctly compares t-distributions to the normal distribution?
I. t distributions are also unimodal, mound shaped and symmetric.
II. t distributions have more spread than the normal distribution.
III. As degrees of freedom decrease, the variance of t distributions becomes smaller.
(Multiple Choice)
4.9/5 (28)
Gas mileage Hoping to improve the gas mileage of their cars, a car company has made an adjustment in the manufacturing process. Random samples of automobiles coming off the assembly line have been measured each week that the plant has been in operation. The data from before and after the manufacturing adjustments were made are in the table below. It is believed that measurements of gas mileage are normally distributed. Write a
complete conclusion about the manufacturing adjustments based on the statistical software
printout shown below. SET M1 24 21 26 25 23 24 19 22 20 24 20 21 27 22 SET M2 22 24 28 28 27 24 22 24 27 25 27 23 28
Mean StDev SEMean M1 14 22.71 2.40 0.64 M2 13 25.31 2.29 0.64
(Essay)
4.8/5 (38)
The two samples whose statistics are given in the table are thought to come from populations with equal variances. What is the pooled estimate of the population standard deviation?
Mean SD 50 22 3 55 25 4
(Multiple Choice)
4.9/5 (41)
We want to know the mean winning score at the US Open golf championship. An internet search gives us all the scores for the history of that tournament, and we create a 95% confidence interval based on a t-distribution. This procedure was not appropriate. Why?
(Multiple Choice)
4.7/5 (35)
A total of 23 Gossett High School students were admitted to State University. Of those students, 7 were offered athletic scholarships. The school's guidance counselor looked at their composite ACT scores (shown in the table), wondering if State U. might admit people with lower scores if they also were athletes. Assuming that this group of students is representative of students throughout the state, what do you think?
Non-athletes Athletes 2521 22 2227 21 1929 24 2526 27 2430 19 2527 23 2426 17 2323
-Create and interpret a 90% confidence interval.
(Essay)
4.9/5 (28)
Based on data from two very large independent samples, two students tested a hypothesis about equality of population means using a = 0.05. One student used a one-tail test and rejected the null hypothesis, but the other used a two-tail test and failed to reject the null hypothesis. Which of these might have been their calculated value of t?
(Multiple Choice)
4.9/5 (37)
You could win a $1000 prize by tossing a coin in one of two games. To win Game A, you must get exactly 50% heads. To win Game B, you must get between 45% and 55% heads. Although which game you must play will be chosen randomly, then you may decide whether to toss the coin 20 times or 50 times. How many tosses would you choose to make?
(Multiple Choice)
4.7/5 (31)
Investigators at an agricultural research facility randomly assigned equal numbers of chickens to be housed in two rooms. In one room a group of chickens experienced normal day/night cycles, while in the other room lights were left on 24 hours a day to see if those chickens would lay more eggs. After collecting data for several days the researchers tested the hypothesis H₀: µ₁ - µ₂ = 0 against the one-tail alternative and found P = 0.22. Which is true?
(Multiple Choice)
4.7/5 (29)
A producer of a new diet supplement pill boasts that their product helps users lose more weight than the current leading brand. The provide evidence from a double-blind placebo controlled randomized clinical trial which tested the null hypothesis H₀: µnew - µold = 0 against the alternative HA: µnew - µold > 0 where µ represents the mean weight loss. Which of the following would be a Type I error?
(Multiple Choice)
4.9/5 (36)
Insurance companies track life expectancy information to assist in determining the cost of life insurance policies. The insurance company knows that, last year, the life expectancy of its policyholders was 77 years. They want to know if their clients this year have a longer life expectancy, on average, so the company randomly samples some of the recently paid policies to see if the mean life expectancy of policyholders has increased. The insurance company will only change their premium structure if there is evidence that people who buy their policies are living longer than before.
86 75 83 84 81 77 78 79 79 81 76 85 70 76 79 81 73 74 72 83
-For more accurate cost determination, the insurance companies want to estimate the life expectancy to within one year with 95% confidence. How many randomly selected records would they need to have?
(Essay)
4.7/5 (43)
Starting Salaries A recruiting firm report on starting salaries states that starting salaries for finance majors are skewed to the right, with a nationwide mean of $58,993.
a. We collect starting salary data from a random sample of 50 recently graduated finance majors from a well- regarded business program at a large state university. Why is it okay to use these data for inference even though the population is skewed?
b. The standard deviation of the 50 salaries in our sample was $11,717. Specify the
sampling model (shape, center, spread) for the mean price of such samples.
c. This sample of randomly chosen salaries produced a 90% confidence interval for the mean starting salary for finance majors from this business program ($59347, $64903). Does this interval provide evidence that starting salaries are unusually high for graduates from
the business program at this university? Explain briefly.
d. Suppose we hope improve our estimate by choosing a new sample. How many starting salaries must we survey to have 90% confidence of estimating the mean starting salary to within $1000?
(Essay)
5.0/5 (36)
The average American sees 3.9 movies at the theater each year. A curious student polls 30 friends and family over the course of a week. He finds that his friends have seen an average of 4.5 movies with a standard deviation of 1.2 movies.
-Find and interpret a 95% confidence interval for this sample.
(Essay)
4.9/5 (37)
Too much TV? A father is concerned that his teenage son is watching too much television each day, since his son watches an average of 2 hours per day. His son says that his TV habits are no different than those of his friends. Since this father has taken a stats class, he knows that he can actually test to see whether or not his son is watching more TV than his peers. The father collects a random sample of television watching times from boys at his son's high school and gets the following data:
1.9 2.3 2.2 1.9 1.6 2.6 1.4 2.0 2.0 2.2
Is the father right? That is, is there evidence that other boys average less than 2 hours of television per day? Conduct a hypothesis test, making sure to state your conclusions in the context of the problem.
(Essay)
4.9/5 (38)
Filters
- Essay(0)
- Multiple Choice(0)
- Short Answer(0)
- True False(0)
- Matching(0)