Exam 21: The Theory of Consumer Choice
Exam 1: Ten Principles of Economics387 Questions
Exam 2: Thinking Like an Economist569 Questions
Exam 3: Interdependence and the Gains From Trade463 Questions
Exam 4: The Market Forces of Supply and Demand606 Questions
Exam 5: Elasticity and Its Application524 Questions
Exam 6: Supply,demand,and Government Policies593 Questions
Exam 7: Consumers,producers,and the Efficiency of Markets496 Questions
Exam 8: Application: The Costs of Taxation453 Questions
Exam 9: Application: International Trade441 Questions
Exam 10: Externalities473 Questions
Exam 11: Public Goods and Common Resources388 Questions
Exam 12: The Design of the Tax System499 Questions
Exam 13: The Costs of Production507 Questions
Exam 14: Firms in Competitive Markets502 Questions
Exam 15: Monopoly541 Questions
Exam 16: Monopolistic Competition521 Questions
Exam 17: Oligopoly428 Questions
Exam 18: The Market for the Factors of Production477 Questions
Exam 19: Earnings and Discrimination425 Questions
Exam 20: Income Inequality and Poverty399 Questions
Exam 21: The Theory of Consumer Choice492 Questions
Exam 22: Frontiers of Microeconomics380 Questions
Exam 23: Measuring a Nations Income464 Questions
Exam 24: Measuring the Cost of Living452 Questions
Exam 25: Production and Growth457 Questions
Exam 26: Saving,investment,and the Financial System502 Questions
Exam 27: The Basic Tools of Finance461 Questions
Exam 28: Unemployment610 Questions
Exam 29: The Monetary System461 Questions
Exam 30: Money Growth and Inflation427 Questions
Exam 31: Open-Economy Macroeconomic Models488 Questions
Exam 32: A Macroeconomic Theory of the Open Economy404 Questions
Exam 33: Aggregate Demand and Aggregate Supply511 Questions
Exam 34: The Influence of Monetary and Fiscal Policy on Aggregate Demand451 Questions
Exam 35: The Short-Run Trade-Off Between Inflation and Unemployment415 Questions
Exam 36: Six Debates Over Macroeconomic Policy273 Questions
Select questions type
Explain the difference between inferior and normal goods.As a developing economy experiences increases in income (measured by GDP),what would you predict to happen to demand for inferior goods?
(Essay)
4.8/5  (34)
(34)
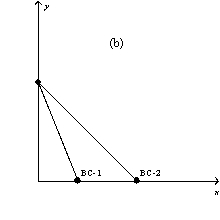
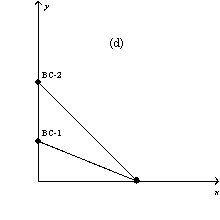
Figure 21-3
In each case,the budget constraint moves from BC-1 to BC-2. 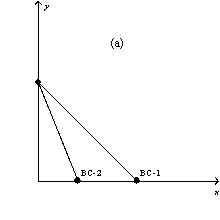

 -Refer to Figure 21-3.Which of the graphs in the figure reflects an increase in the price of good Y only?
(Multiple Choice)
4.8/5 (44)
Suppose that you have $100 today and expect to receive $100 one year from today.Your money market account pays an annual interest rate of 25%,and you may borrow money at that interest rate.If you save all your money,how much money will you have one year from today?
(Multiple Choice)
4.8/5 (32)
Traci consumes two goods,lemonade and pretzels.Lemonade costs $1 per glass,and she consumes it to the point where the marginal utility she receives from her last glass of lemonade is 3.Pretzels cost $2 per bag.The relationship between the marginal utility Traci gets from eating a bag of pretzels and the number of bags she eats per month is as follows:  If Traci is maximizing his utility,how many bags of potato chips does he buy each month?
(Multiple Choice)
4.7/5 (32)
Refer to Scenario 21-1.If the consumer's income rises to $60,then the budget line for hot wings and beer would
(Multiple Choice)
4.7/5 (38)
In the upward-sloping portion of the individual labor-supply curve,the substitution effect is
(Multiple Choice)
4.8/5 (39)
Consider the budget constraint between "spending today" on the horizontal axis and "spending a year from today" on the vertical axis.Suppose that you have $100 today and expect to receive $100 one year from today.Your money market account pays an annual interest rate of 25%,and you may borrow money at that interest rate.Suppose now that the interest rate increases to 40%.What happens to the slope of your budget constraint relative to when the interest rate was 25%? The slope
(Multiple Choice)
4.7/5 (40)
A consumer has preferences over two goods,X and Y.Suppose we graph this consumer's preferences (which satisfy the usual properties of indifference curves)and budget constraint on a diagram with X on the horizontal axis and Y on the vertical axis.At the consumer's current consumption bundle,the consumer is spending all available income,and the marginal rate of substitution is greater than the slope of the budget constraint.We can conclude that the consumer
(Multiple Choice)
4.9/5 (47)
If the price of a good increases,all else equal,consumers perceive
(Multiple Choice)
5.0/5 (43)
Figure 21-22 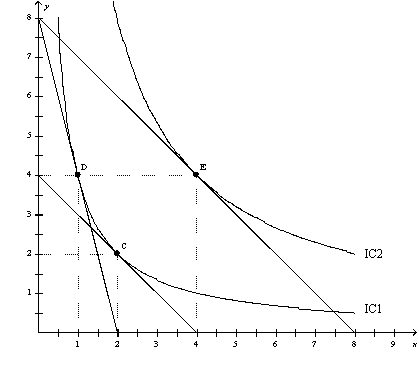 -Refer to Figure 21-22.When the price of X is $80,the price of Y is $20,and the consumer's income is $160,the consumer's optimal choice is D.Then the price of X decreases to $20.The substitution effect can be illustrated as the movement from
(Multiple Choice)
4.9/5 (40)
Figure 21-26
The figure below illustrates the preferences of a representative consumer,Carlos. 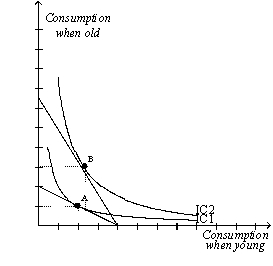 -Refer to Figure 21-26.Interest rates increase by 4 percent.Carlos's optimal choice point moves from A to B.Carlos consumes
(Multiple Choice)
4.8/5 (42)
As more units of an item are purchased,everything else equal,marginal satisfaction from consuming additional units will tend to
(Multiple Choice)
4.7/5 (32)
Figure 21-6 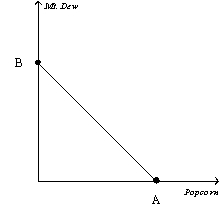 -Refer to Figure 21-6.Suppose a consumer has $100 in income,the price of Mt.Dew is $2,and the value of A is 200.What is the price of popcorn?
(Multiple Choice)
4.9/5 (39)
Figure 21-3
In each case,the budget constraint moves from BC-1 to BC-2.
-Refer to Figure 21-3.Which of the graphs in the figure reflects a decrease in the price of good Y only?
(Multiple Choice)
4.8/5 (45)
Each of the following are characteristics of a typical indifference curve map except
(Multiple Choice)
4.8/5 (36)
Good X is a Giffen good.When the price of X increases,the consumer will consume
(Multiple Choice)
4.9/5 (27)
Filters
- Essay(0)
- Multiple Choice(0)
- Short Answer(0)
- True False(0)
- Matching(0)