Exam 21: The Theory of Consumer Choice
Exam 1: Ten Principles of Economics387 Questions
Exam 2: Thinking Like an Economist569 Questions
Exam 3: Interdependence and the Gains From Trade463 Questions
Exam 4: The Market Forces of Supply and Demand606 Questions
Exam 5: Elasticity and Its Application524 Questions
Exam 6: Supply,demand,and Government Policies593 Questions
Exam 7: Consumers,producers,and the Efficiency of Markets496 Questions
Exam 8: Application: The Costs of Taxation453 Questions
Exam 9: Application: International Trade441 Questions
Exam 10: Externalities473 Questions
Exam 11: Public Goods and Common Resources388 Questions
Exam 12: The Design of the Tax System499 Questions
Exam 13: The Costs of Production507 Questions
Exam 14: Firms in Competitive Markets502 Questions
Exam 15: Monopoly541 Questions
Exam 16: Monopolistic Competition521 Questions
Exam 17: Oligopoly428 Questions
Exam 18: The Market for the Factors of Production477 Questions
Exam 19: Earnings and Discrimination425 Questions
Exam 20: Income Inequality and Poverty399 Questions
Exam 21: The Theory of Consumer Choice492 Questions
Exam 22: Frontiers of Microeconomics380 Questions
Exam 23: Measuring a Nations Income464 Questions
Exam 24: Measuring the Cost of Living452 Questions
Exam 25: Production and Growth457 Questions
Exam 26: Saving,investment,and the Financial System502 Questions
Exam 27: The Basic Tools of Finance461 Questions
Exam 28: Unemployment610 Questions
Exam 29: The Monetary System461 Questions
Exam 30: Money Growth and Inflation427 Questions
Exam 31: Open-Economy Macroeconomic Models488 Questions
Exam 32: A Macroeconomic Theory of the Open Economy404 Questions
Exam 33: Aggregate Demand and Aggregate Supply511 Questions
Exam 34: The Influence of Monetary and Fiscal Policy on Aggregate Demand451 Questions
Exam 35: The Short-Run Trade-Off Between Inflation and Unemployment415 Questions
Exam 36: Six Debates Over Macroeconomic Policy273 Questions
Select questions type
Figure 21-22 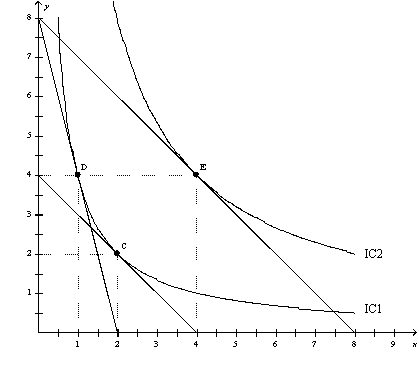 -Refer to Figure 21-22.When the price of X is $80,the price of Y is $20,and the consumer's income is $160,the consumer's optimal choice is D.Then the price of X decreases to $20.The demand curve can be illustrated as the movement from
(Multiple Choice)
4.8/5  (35)
(35)
Figure 21-2.The graph shows two budget constraints for a consumer. 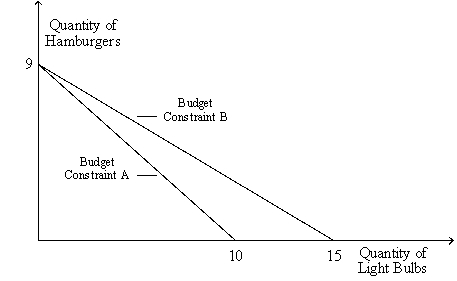 -Refer to Figure 21-2.Suppose the price of a hamburger is $10 and Budget Constraint A applies.What is the consumer's income? What is the price of a light bulb?
(Essay)
4.9/5 (36)
If the consumer's income and all prices simultaneously decrease by one-half,then the optimum consumption will
(Multiple Choice)
4.8/5 (35)
Figure 21-9 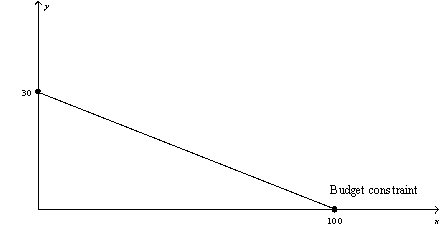 -Refer to Figure 21-9.If the consumer has $600 in income,what is the price of good X?
(Multiple Choice)
4.9/5 (42)
Suppose a consumer consumes two goods,X and Y.The relative price of the two goods equals the
(Multiple Choice)
4.9/5 (30)
Figure 21-19
The following graph illustrates a representative consumer's preferences for marshmallows and chocolate chip cookies: 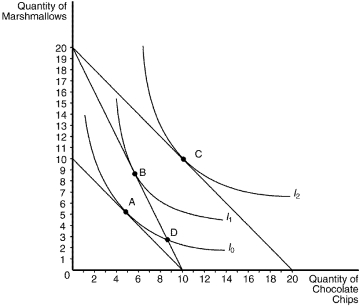 -Refer to Figure 21-19.Assume that the consumer has an income of $40.If the price of chocolate chips is $4 and the price of marshmallows is $4,the optimizing consumer would choose to purchase
(Multiple Choice)
4.8/5 (28)
Thomas faces prices of $6 for a unit of good X and $30 for a unit of good Y.At his optimum,Thomas is willing to give up 1 unit of good Y for __________ units of good X.
(Short Answer)
4.9/5 (34)
Figure 21-19
The following graph illustrates a representative consumer's preferences for marshmallows and chocolate chip cookies:
-Refer to Figure 21-19.Assume that the consumer has an income of $80.If the price of chocolate chips is $4 and the price of marshmallows is $4,the optimizing consumer would choose to purchase
(Multiple Choice)
4.9/5 (47)
Figure 21-1.The figure shows three indifference curves and a budget constraint for a certain consumer named Jack. 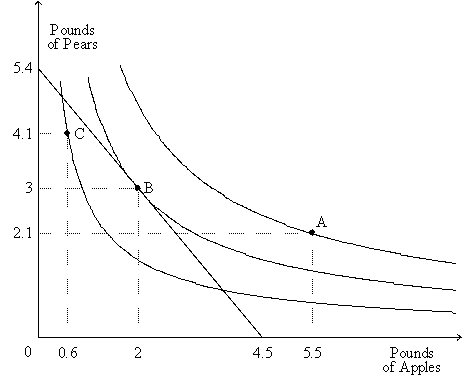 -Refer to Figure 21-1.Jack
(Multiple Choice)
4.9/5 (28)
Laura consumes only beer and chips.Her indifference curves are all bowed inward.Consider the bundles (2,6), (4,4),and (6,2).If Laura is indifferent between (2,6)and (6,2),then Laura must
(Multiple Choice)
4.9/5 (45)
Figure 21-12 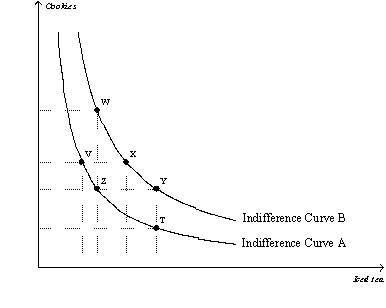 -Refer to Figure 21-12.The marginal rate of substitution between bundles V and Z is
(Multiple Choice)
4.8/5 (29)
Figure 21-21 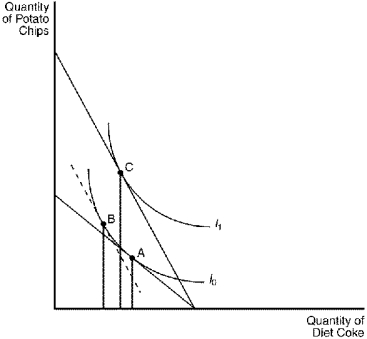 -Refer to Figure 21-21.If the consumer is currently at point A in the figure,a movement to point B as a result of a decrease in the price of potato chips represents the
(Multiple Choice)
4.9/5 (36)
Figure 21-1.The figure shows three indifference curves and a budget constraint for a certain consumer named Jack.
-Refer to Figure 21-1.In moving from point A to point C,Jack gives up
(Multiple Choice)
5.0/5 (41)
If a consumer consumes two goods,X and Y,and has indifference curves that are bowed inward,the consumer's optional choice occurs when
(Multiple Choice)
4.9/5 (28)
The income effect in the work-leisure model induces a person to work less in response to higher wages,which tends to make the labor-supply curve slope backward.
(True/False)
4.8/5 (36)
Angie is maximizing total utility while consuming food and clothing.Her marginal utility from food is 50,and her marginal utility from clothing is 25.If clothing is priced at $10 per unit,the price of food per unit must be
(Multiple Choice)
4.9/5 (43)
Energy drinks and granola bars are normal goods.When the price of energy drinks decreases,the income effect causes a
(Multiple Choice)
4.8/5 (29)
Figure 21-10 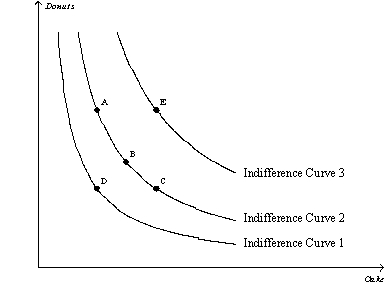 -Refer to Figure 21-10.A person that chooses to consume bundle C is likely to
(Multiple Choice)
4.9/5 (44)
Filters
- Essay(0)
- Multiple Choice(0)
- Short Answer(0)
- True False(0)
- Matching(0)