Exam 21: The Theory of Consumer Choice
Exam 1: Ten Principles of Economics387 Questions
Exam 2: Thinking Like an Economist569 Questions
Exam 3: Interdependence and the Gains From Trade463 Questions
Exam 4: The Market Forces of Supply and Demand606 Questions
Exam 5: Elasticity and Its Application524 Questions
Exam 6: Supply,demand,and Government Policies593 Questions
Exam 7: Consumers,producers,and the Efficiency of Markets496 Questions
Exam 8: Application: The Costs of Taxation453 Questions
Exam 9: Application: International Trade441 Questions
Exam 10: Externalities473 Questions
Exam 11: Public Goods and Common Resources388 Questions
Exam 12: The Design of the Tax System499 Questions
Exam 13: The Costs of Production507 Questions
Exam 14: Firms in Competitive Markets502 Questions
Exam 15: Monopoly541 Questions
Exam 16: Monopolistic Competition521 Questions
Exam 17: Oligopoly428 Questions
Exam 18: The Market for the Factors of Production477 Questions
Exam 19: Earnings and Discrimination425 Questions
Exam 20: Income Inequality and Poverty399 Questions
Exam 21: The Theory of Consumer Choice492 Questions
Exam 22: Frontiers of Microeconomics380 Questions
Exam 23: Measuring a Nations Income464 Questions
Exam 24: Measuring the Cost of Living452 Questions
Exam 25: Production and Growth457 Questions
Exam 26: Saving,investment,and the Financial System502 Questions
Exam 27: The Basic Tools of Finance461 Questions
Exam 28: Unemployment610 Questions
Exam 29: The Monetary System461 Questions
Exam 30: Money Growth and Inflation427 Questions
Exam 31: Open-Economy Macroeconomic Models488 Questions
Exam 32: A Macroeconomic Theory of the Open Economy404 Questions
Exam 33: Aggregate Demand and Aggregate Supply511 Questions
Exam 34: The Influence of Monetary and Fiscal Policy on Aggregate Demand451 Questions
Exam 35: The Short-Run Trade-Off Between Inflation and Unemployment415 Questions
Exam 36: Six Debates Over Macroeconomic Policy273 Questions
Select questions type
If the price of bread is zero,the budget constraint between bread (on the vertical axis)and cheese (on the horizontal axis)would
(Multiple Choice)
4.9/5  (38)
(38)
A consumer's optimal choice is affected by income,prices of goods,and preferences.
(True/False)
4.8/5 (35)
Which of the following is not a property of a typical indifference curve?
(Multiple Choice)
4.7/5 (36)
A good is an inferior good if the consumer buys less of it when
(Multiple Choice)
4.7/5 (35)
At a consumer's optimal choice,the consumer chooses the combination of goods that equates the marginal rate of substitution and the price ratio.
(True/False)
4.8/5 (43)
When we derive the demand curve for a good,we should remember that the
(Multiple Choice)
4.7/5 (36)
Consider the indifference curve map for nickels and quarters.Assume nickels are on the vertical axis and quarters are on the horizontal axis.The indifference curves for nickels and quarters are
(Multiple Choice)
4.8/5 (36)
At a consumer's optimal choice,the consumer chooses the combination of goods such that the ratio of the marginal utilities equals the ratio of the prices.
(True/False)
4.8/5 (41)
Figure 21-4
In each case,the budget constraint moves from BC-1 to BC-2. 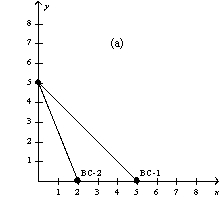
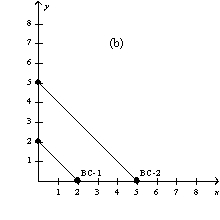
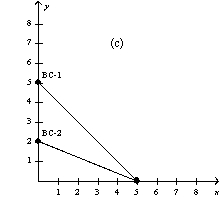
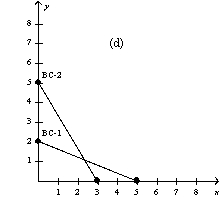 -Refer to Figure 21-4.Which of the graphs in the figure could reflect an increase in income?
(Multiple Choice)
4.8/5 (39)
A consumer's budget constraint is drawn with the quantity of pizza measured along the horizontal axis and the price of Pepsi measured along the vertical axis.If the market is offering the consumer the trade-off of 3 pints of Pepsi for 1 pizza,then what is the slope of the consumer's budget constraint?
(Essay)
4.9/5 (37)
Figure 21-1.The figure shows three indifference curves and a budget constraint for a certain consumer named Jack. 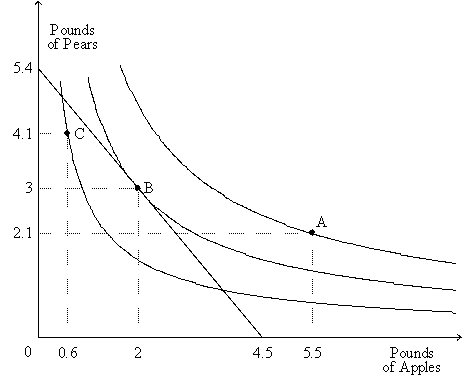 -Refer to Figure 21-1.Which of the following pairs of prices matches the appearance of the budget constraint?
(Multiple Choice)
4.7/5 (35)
Assume that a college student purchases only Ramen noodles and textbooks.If Ramen noodles are an inferior good and textbooks are a normal good,then the substitution effect associated with a decrease in the price of Ramen noodles,by itself,will result in
(Multiple Choice)
4.8/5 (35)
Higher indifference curves are preferred to lower ones as long as the
(Multiple Choice)
4.8/5 (45)
Figure 21-1.The figure shows three indifference curves and a budget constraint for a certain consumer named Jack.
-Refer to Figure 21-1.If Jack's income is $12.60,then the price of a pound of apples is
(Multiple Choice)
4.9/5 (32)
Consider the indifference curve map and budget constraint for two goods,beef and potatoes.Suppose the good measured on the horizontal axis,potatoes,is a Giffen good.Beef is measured on the vertical axis and is a normal good.When the price of potatoes increases,the substitution effect causes
(Multiple Choice)
4.9/5 (34)
When two goods are perfect complements,the indifference curves are right angles.
(True/False)
4.8/5 (39)
Figure 21-11 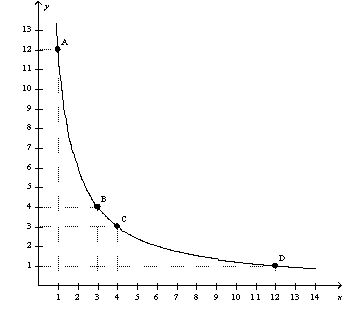 -Refer to Figure 21-11.What is the consumer's marginal rate of substitution?
(Multiple Choice)
4.7/5 (29)
Figure 21-14 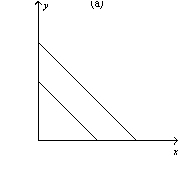
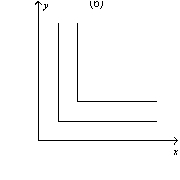
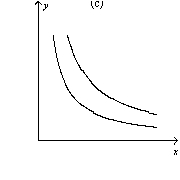 -Refer to Figure 21-14.Which of the graphs illustrates indifference curves for which the marginal rate of substitution is undefined?
(Multiple Choice)
4.8/5 (43)
Filters
- Essay(0)
- Multiple Choice(0)
- Short Answer(0)
- True False(0)
- Matching(0)