Exam 21: The Theory of Consumer Choice
Exam 1: Ten Principles of Economics387 Questions
Exam 2: Thinking Like an Economist569 Questions
Exam 3: Interdependence and the Gains From Trade463 Questions
Exam 4: The Market Forces of Supply and Demand606 Questions
Exam 5: Elasticity and Its Application524 Questions
Exam 6: Supply,demand,and Government Policies593 Questions
Exam 7: Consumers,producers,and the Efficiency of Markets496 Questions
Exam 8: Application: The Costs of Taxation453 Questions
Exam 9: Application: International Trade441 Questions
Exam 10: Externalities473 Questions
Exam 11: Public Goods and Common Resources388 Questions
Exam 12: The Design of the Tax System499 Questions
Exam 13: The Costs of Production507 Questions
Exam 14: Firms in Competitive Markets502 Questions
Exam 15: Monopoly541 Questions
Exam 16: Monopolistic Competition521 Questions
Exam 17: Oligopoly428 Questions
Exam 18: The Market for the Factors of Production477 Questions
Exam 19: Earnings and Discrimination425 Questions
Exam 20: Income Inequality and Poverty399 Questions
Exam 21: The Theory of Consumer Choice492 Questions
Exam 22: Frontiers of Microeconomics380 Questions
Exam 23: Measuring a Nations Income464 Questions
Exam 24: Measuring the Cost of Living452 Questions
Exam 25: Production and Growth457 Questions
Exam 26: Saving,investment,and the Financial System502 Questions
Exam 27: The Basic Tools of Finance461 Questions
Exam 28: Unemployment610 Questions
Exam 29: The Monetary System461 Questions
Exam 30: Money Growth and Inflation427 Questions
Exam 31: Open-Economy Macroeconomic Models488 Questions
Exam 32: A Macroeconomic Theory of the Open Economy404 Questions
Exam 33: Aggregate Demand and Aggregate Supply511 Questions
Exam 34: The Influence of Monetary and Fiscal Policy on Aggregate Demand451 Questions
Exam 35: The Short-Run Trade-Off Between Inflation and Unemployment415 Questions
Exam 36: Six Debates Over Macroeconomic Policy273 Questions
Select questions type
The income effect of a price change is the change in consumption that results from the movement to a new indifference curve.
(True/False)
5.0/5  (38)
(38)
Casey consumes two goods,hamburgers and ice cream sandwiches.He has maximized his utility given his income.Ice cream sandwiches costs $2,and he consumes them to the point where the marginal utility he receives is 6.Hamburgers cost $4,and the relationship between the marginal utility that Casey gets from eating hamburgers and the number he eats per month is as follows:  How many hamburgers does Casey buy each month?
(Multiple Choice)
4.8/5 (47)
Figure 21-13 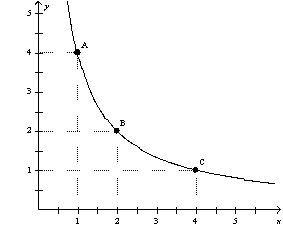 -Refer to Figure 21-13.As the consumer moves from A to B to C,the marginal rate of substitution
(Multiple Choice)
4.8/5 (39)
The rate at which a consumer is willing to trade one good for another to maintain the same level of satisfaction is affected by the
(Multiple Choice)
4.7/5 (38)
For Antonio,the income effect of an interest-rate increase is stronger than the substitution effect.In response to a higher interest rate,will Antonio save more or will he save less?
(Essay)
4.9/5 (41)
The rate at which a consumer is willing to exchange one good for another while maintaining a constant level of satisfaction is called the
(Multiple Choice)
4.9/5 (39)
Figure 21-2.The graph shows two budget constraints for a consumer. 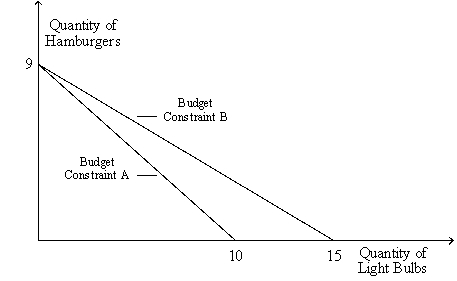 -Refer to Figure 21-2.What particular change would result in a rotation of the budget constraint from Budget Constraint A to Budget Constraint B?
(Essay)
4.8/5 (37)
Consider the indifference curve map and budget constraint for two goods,X and Y.Suppose the good on the horizontal axis,X,is normal.When the price of X increases,the substitution effect
(Multiple Choice)
4.9/5 (43)
Figure 21-24 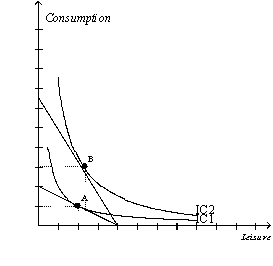 -Refer to Figure 21-24.Anna experiences an increase in her hourly wage.Her optimal choice point moves from A to B.For Anna,
(Multiple Choice)
4.9/5 (33)
Which of the following descriptions best depicts the substitution effect?
(Multiple Choice)
4.8/5 (31)
A consumer's preferences for $1 bills and $20 bills can be represented by indifference curves that are
(Multiple Choice)
4.9/5 (37)
Dave consumes two normal goods,X and Y,and is currently at an optimum.If the price of good X falls,we can predict with certainty that
(Multiple Choice)
4.8/5 (38)
A consumer consumes two normal goods,coffee and chocolate.The price of coffee rises.The income effect,by itself,suggests that the consumer will consume
(Multiple Choice)
4.8/5 (41)
Figure 21-5
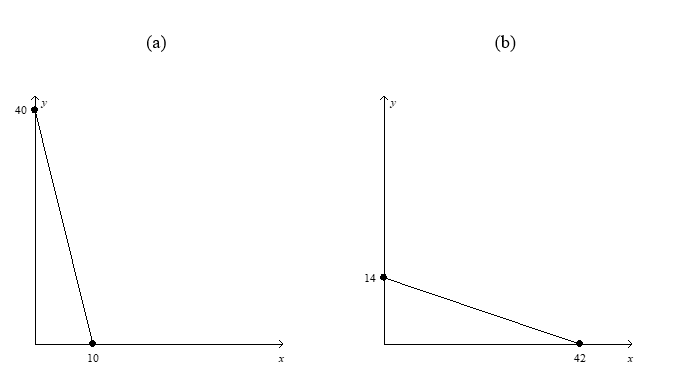 -Refer to Figure 21-5.In graph (a),what is the price of good Y relative to good X (i.e. ,Py/Px)?
(Multiple Choice)
4.8/5 (34)
All of the following are properties of typical indifference curves except
(Multiple Choice)
4.8/5 (33)
Assume that a person consumes two goods,Coke and Snickers.Use a graph to demonstrate how the consumer adjusts his/her optimal consumption bundle when the price of Coke decreases.Carefully label all curves and axes.What will happen to consumption if Coke is a normal good? What will happen to consumption if Coke is an inferior good? (Remember to explain the possible change when the income effect dominates and when the substitution effect dominates. )
(Essay)
4.8/5 (41)
Figure 21-19
The following graph illustrates a representative consumer's preferences for marshmallows and chocolate chip cookies: 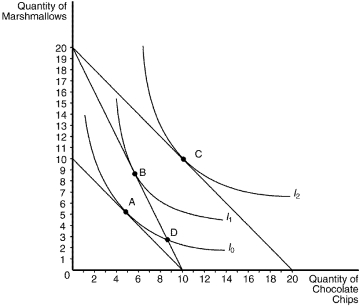 -Refer to Figure 21-19.Assume that the consumer depicted the figure has an income of $50.Based on the information available in the graph,which of the following price-quantity combinations would be on her demand curve for chocolate chips if the price of marshmallows is $2.50?
(Multiple Choice)
4.9/5 (36)
Filters
- Essay(0)
- Multiple Choice(0)
- Short Answer(0)
- True False(0)
- Matching(0)