Exam 3: Using Supply and Demand to Analyze Markets
Exam 2: Supply and Demand109 Questions
Exam 3: Using Supply and Demand to Analyze Markets104 Questions
Exam 4: Consumer Behavior119 Questions
Exam 5: Individual and Market Demand103 Questions
Exam 6: Producer Behavior102 Questions
Exam 7: Costs102 Questions
Exam 8: Supply in a Competitive Market93 Questions
Exam 9: Market Power and Monopoly97 Questions
Exam 10: Market Power and Pricing Strategies100 Questions
Exam 11: Imperfect Competition99 Questions
Exam 12: Game Theory96 Questions
Exam 13: Factor Markets70 Questions
Exam 14: Investment, Time, and Insurance77 Questions
Exam 15: General Equilibrium79 Questions
Exam 16: Asymmetric Information79 Questions
Exam 17: Externalities and Public Goods80 Questions
Exam 18: Behavioral and Experimental Economics79 Questions
Select questions type
The supply and demand for 9-volt batteries are given by QD = 230 - 10P and QS = 30P - 10, where P is the price per four-pack and Q measures the number of four-packs. 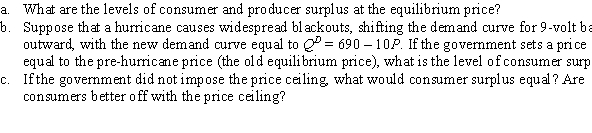
(Essay)
4.8/5  (29)
(29)
The supply curve for pizza on the local college campus is represented by QS = -2,500 + 210P. At a price of $14, the total producer surplus for the college campus would be $_____.
(Short Answer)
4.9/5 (41)
In the market for used cars, the demand and supply equations are given by QD = 12,000 - 0.4P and QS = 0.1P + 5,000, where P is the price per car and Q measures the quantity of cars. What is the size of the deadweight loss at a price floor of $15,000?
(Multiple Choice)
4.9/5 (34)
The supply and demand for solar panels are given by QS = 5P - 5,000 and QD = 15,000 - 5P, where P is price per solar panel and Q measures the quantity of solar panels. Suppose the government provides a $500 subsidy per solar panel. 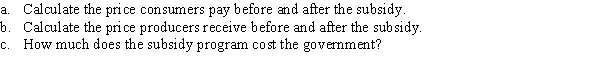
(Essay)
4.8/5 (42)
If the legal burden of a tax is passed from sellers to buyers:
(Multiple Choice)
4.9/5 (35)
Use the following to answer question:
Figure 3.21 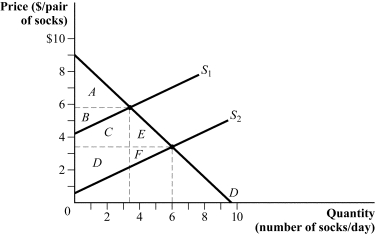 -(Figure 3.21) Refer to Figure 3.21 to answer the following questions:
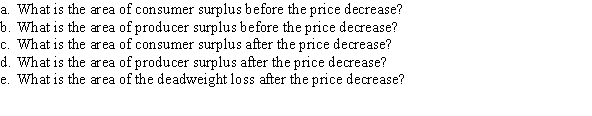
(Essay)
4.8/5 (39)
The demand curve for pizza on the college campus is represented by QD = 1,000 - 40P. At a price of $14, the total consumer surplus for the college campus would be $_____.
(Short Answer)
4.8/5 (38)
The demand and supply of ethanol are given by QD = 8,000 - 2,000P and QS = 1,000P - 1,000, where P is price per gallon and Q measures gallons per minute. If the government subsidizes ethanol at $0.30 per gallon, what is the deadweight loss?
(Multiple Choice)
4.9/5 (26)
Suppose that a minimum price (price floor) is legislated. To calculate producer surplus:
(Multiple Choice)
5.0/5 (39)
The demand and supply curves for a product are QD = 50 - 0.5P and QS = 2.5P + 5, where P is the price per unit and Q measures millions of units. If the government levies a $1.20 per unit tax on buyers, what is the size of the deadweight loss?
(Multiple Choice)
4.7/5 (33)
Suppose that a local government has imposed a quota of 0.5 million gallons on water usage. Before the quota is enforced, the market demand curve is:
QD = 10 - 2.25P
and the market supply curve is:
QS = -10 + 2.75P
where the quantity is measured in millions of gallons per month and the price is in dollars per thousand gallons. 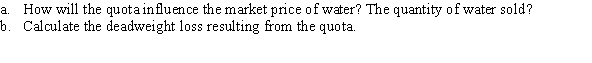
(Essay)
4.9/5 (37)
The market for cookies is represented by the following supply and demand conditions:
QD = 1,000 - 200P and QS = 400P - 200, where P is price per box of cookies and Q measures boxes per day. 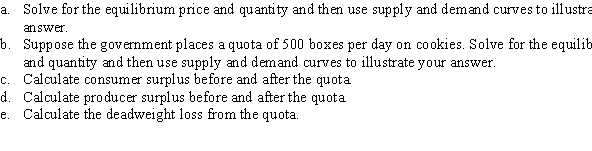
(Essay)
4.7/5 (36)
Suppose the demand and supply curves for units of university credits are given by the following equations:
QD = 5,000 - P
QS = -1,000 + 4P
where QD is the quantity of credits demanded, QS is the quantity supplied, and P is the price charged for each unit in dollars. Suppose that the government wants to make education more accessible and therefore passes a regulation that says no university can charge more than $1,000 per credit. Calculate the deadweight loss associated with this price ceiling.
(Essay)
4.8/5 (36)
Suppose the demand and supply curves for units of university credits are given by the following equations:
QD = 5,000 - P
QS = -1,000 + 4P
where QD is the quantity of credits demanded, QS is the quantity supplied, and P is the price in dollars for each unit. Calculate the producer surplus at the equilibrium price.
(Essay)
4.9/5 (41)
Suppose that technological breakthroughs make jet packs affordable, convenient, and safe for personal transportation. The demand for automobiles would become _____ the consumer surplus from automobiles.
(Multiple Choice)
4.9/5 (34)
Nancy paid $55 for car mats but was willing to pay $80. What is Nancy's consumer surplus?
(Multiple Choice)
4.7/5 (32)
The market for plywood is characterized by the following demand and supply equations: QD = 800 - 10P and QS = 50P - 1,000, where P is the price per sheet of plywood and Q measures the quantity of plywood. If the government imposes a price ceiling of $25 per sheet of plywood, producer surplus:
(Multiple Choice)
4.7/5 (42)
Use the following to answer question:
Figure 3.24 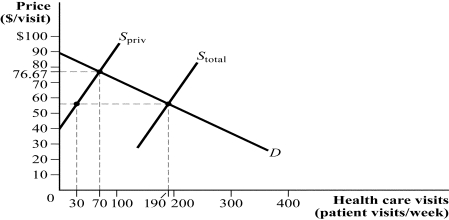 -(Figure 3.24) In Figure 3.24, Spriv represents the supply of health care visits at private clinics and Stotal represents the total supply of health care visits at private and government-operated clinics.
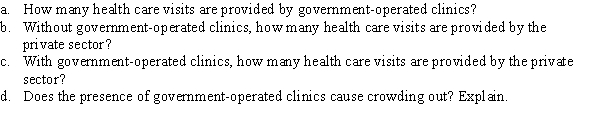
(Essay)
4.8/5 (32)
Use the following to answer question:
Figure 3.26 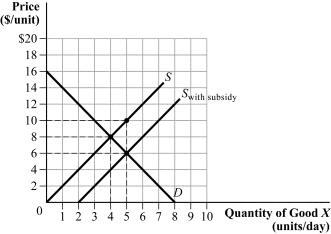 -(Figure 3.26) Use Figure 3.26 to answer the following questions.
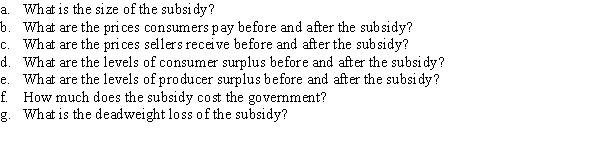
(Essay)
4.8/5 (39)
Filters
- Essay(0)
- Multiple Choice(0)
- Short Answer(0)
- True False(0)
- Matching(0)