Exam 3: Using Supply and Demand to Analyze Markets
Exam 2: Supply and Demand109 Questions
Exam 3: Using Supply and Demand to Analyze Markets104 Questions
Exam 4: Consumer Behavior119 Questions
Exam 5: Individual and Market Demand103 Questions
Exam 6: Producer Behavior102 Questions
Exam 7: Costs102 Questions
Exam 8: Supply in a Competitive Market93 Questions
Exam 9: Market Power and Monopoly97 Questions
Exam 10: Market Power and Pricing Strategies100 Questions
Exam 11: Imperfect Competition99 Questions
Exam 12: Game Theory96 Questions
Exam 13: Factor Markets70 Questions
Exam 14: Investment, Time, and Insurance77 Questions
Exam 15: General Equilibrium79 Questions
Exam 16: Asymmetric Information79 Questions
Exam 17: Externalities and Public Goods80 Questions
Exam 18: Behavioral and Experimental Economics79 Questions
Select questions type
Use the following to answer question:
Figure 3.5 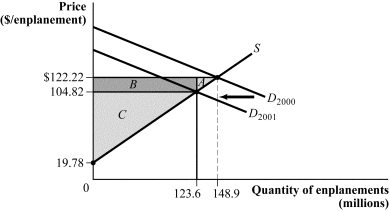 -(Figure 3.5) After September 11, the demand curve for air travel shifted inward, from D2000 to D2001. In 2000 the equilibrium price and quantity were $122.22 and 148.9 million enplanements, respectively. After September 11, the equilibrium price and quantity fell to $104.82 and 123.6 million enplanements, respectively. The loss in producer surplus attributable to the decrease in demand is equal to area:
(Multiple Choice)
4.9/5  (32)
(32)
Use the following to answer question:
Figure 3.17 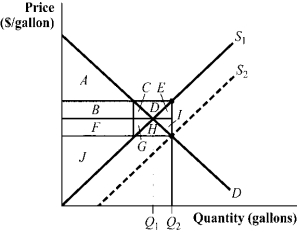 -(Figure 3.17) Figure 3.17 shows the effect of a government subsidy. Which of the following statements is (are) TRUE?
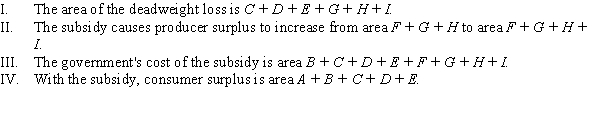
(Multiple Choice)
4.9/5 (36)
Use the following to answer question:
Figure 3.19  -(Figure 3.19) Refer to Figure 3.19 to answer the following question:
(Essay)
4.9/5 (32)
The demand and supply of ethanol are given by QD = 8,000 - 2,000P and QS = 1,000P - 1,000, where P is price per gallon and Q measures gallons per minute. What does it cost the government to subsidize ethanol at $0.30 a gallon?
(Multiple Choice)
4.8/5 (30)
Use the following to answer questions 11-12:
Figure 3.4 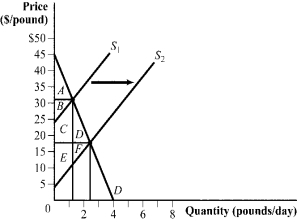 -(Figure 3.4) The outward shift of the supply curve will cause producer surplus to increase from area _____ to area _____.
(Multiple Choice)
4.8/5 (39)
Use the following to answer questions 29-31:
Figure 3.10 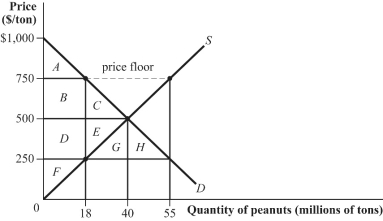 -(Figure 3.10) At a price floor of $750, there is an excess supply of _____ tons of peanuts.
(Multiple Choice)
4.8/5 (44)
Suppose that the demand curve for brown rice is given by 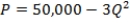 , and supply is
  .
a. Find the equilibrium price and quantity.
b. Calculate the consumer surplus at the equilibrium price.
c. Calculate the producer surplus at the equilibrium price.
.
a. Find the equilibrium price and quantity.
b. Calculate the consumer surplus at the equilibrium price.
c. Calculate the producer surplus at the equilibrium price.
(Essay)
4.8/5 (42)
Suppose that the market demand curve for residential water is:
QD = 10 - 2.25P
and the market supply curve is:
QS = -10 + 2.75P
where the quantity is measured in millions of gallons per month and the price is in dollars per thousand gallons.
a. Calculate the equilibrium price and quantity.
b. Calculate the consumer surplus at the equilibrium price.
(Essay)
4.9/5 (40)
The supply and demand for squash are given by QD = 200,000 - 50,000P and QS = 90,000P - 80,000, where P is price per pound and Q measures pounds of squash. 
(Essay)
4.8/5 (42)
The market for plywood is characterized by the following demand and supply equations: QD = 800 - 10P and QS = 50P - 1,000, where P is the price per sheet of plywood and Q measures the quantity of plywood. What is the size of the deadweight loss if the government imposes a price ceiling of $25 per sheet of plywood?
(Multiple Choice)
4.9/5 (38)
Suppose that last year the equilibrium price and the quantity of good X were $10 and 5 million pounds, respectively. Because of strong demand this year, the equilibrium price and the quantity of good X are $12 and 7 million pounds, respectively. Assuming that the supply curve of good X is linear, producer surplus:
(Multiple Choice)
4.8/5 (40)
Use the following to answer questions 29-31:
Figure 3.10
-(Figure 3.10) If the government mandates a price floor of $750, the area of producer surplus changes from:
(Multiple Choice)
4.9/5 (33)
Use the following to answer questions 22-23:
Figure 3.8  -(Figure 3.8) At a price ceiling of $2, what is the amount of surplus transferred from producers to consumers?
(Multiple Choice)
4.8/5 (40)
If the government subsidizes a product, what is the relationship between the price that buyers pay (PB) and the price that sellers receive (PS)?
(Multiple Choice)
4.7/5 (46)
Filters
- Essay(0)
- Multiple Choice(0)
- Short Answer(0)
- True False(0)
- Matching(0)