Exam 8: Producers in the Long Run
Exam 1: Economic Issues and Concepts88 Questions
Exam 2: Economic Theories, Data, and Graphs96 Questions
Exam 3: Demand, Supply, and Price98 Questions
Exam 4: Elasticity94 Questions
Exam 5: Markets in Action65 Questions
Exam 6: Consumer Behaviour77 Questions
Exam 7: Producers in the Short Run75 Questions
Exam 8: Producers in the Long Run107 Questions
Exam 9: Competitive Markets90 Questions
Exam 10: Monopoly, Cartels, and Price Discrimination79 Questions
Exam 11: Imperfect Competition95 Questions
Exam 12: Economic Efficiency and Public Policy96 Questions
Select questions type
The following table shows the marginal products of capital (K) and labour (L) for various methods for Firm ABC to produce 1000 toys per day. 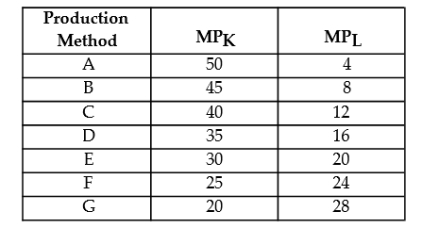 TABLE 8-2
-Refer to Table 8-2. Suppose the firm is employing production method G. How should this firm adjust its use of capital and labour in order to minimize costs?
TABLE 8-2
-Refer to Table 8-2. Suppose the firm is employing production method G. How should this firm adjust its use of capital and labour in order to minimize costs?
Free
(Multiple Choice)
4.9/5  (28)
(28)
Correct Answer: Verified
E
Suppose a firm employs two inputs, X and Y, and that at their current levels of use MPX/PX >MPY/PY. To minimize the cost of production, the firm should hire
Free
(Multiple Choice)
4.7/5 (35)
Correct Answer:Verified
E
The following table shows the marginal products of capital (K) and labour (L) for various methods for Firm ABC to produce 1000 toys per day. 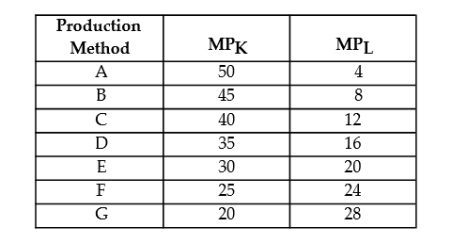 TABLE 8-2
-Refer to Table 8-2. Suppose capital costs $6 per unit and labour costs $4 per unit and the firm is employing production method A. How should this firm adjust its use of capital and labour to minimize costs?
TABLE 8-2
-Refer to Table 8-2. Suppose capital costs $6 per unit and labour costs $4 per unit and the firm is employing production method A. How should this firm adjust its use of capital and labour to minimize costs?
Free
(Multiple Choice)
4.9/5 (30)
Correct Answer:Verified
D
The table below shows the number of units of labour and capital used in 4 alternative production techniques for producing 1000 widgets per month. 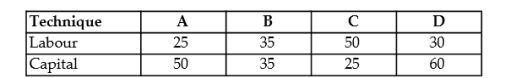 TABLE 8-1
-Refer to Table 8-1. If the price of labour is $5 and the price of capital is $10, which production technique minimizes the costs of producing 1000 units of output?
TABLE 8-1
-Refer to Table 8-1. If the price of labour is $5 and the price of capital is $10, which production technique minimizes the costs of producing 1000 units of output?
(Multiple Choice)
4.8/5 (32)
The figure below shows the isocost lines facing a firm producing golf tees.  FIGURE 8-5
-Refer to Figure 8-5. Given the information provided about the isocost lines, we know that the per unit price of capital is _ and the per unit price of labour is _ .
FIGURE 8-5
-Refer to Figure 8-5. Given the information provided about the isocost lines, we know that the per unit price of capital is _ and the per unit price of labour is _ .
(Multiple Choice)
5.0/5 (42)
Assume a firm is using 10 units of capital and 10 units of labour to produce 10 widgets per hour. Bydoubling both inputs the result is a doubling of output. This firm is experiencing
(Multiple Choice)
4.8/5 (39)
Canada has a much lower population density than does Japan. Therefore, the price of land (relative to the price of labour) is lower in Canada than in Japan. Consider a Canadian firm and a Japanese firm, both producing rice, both having access to the same technologies, and both striving to minimize costs. Now suppose that the relative price of land rises in Canada but remains the samein Japan. The effect will be to
(Multiple Choice)
4.9/5 (37)
Which of the following paired concepts are equivalent to each other?
(Multiple Choice)
4.9/5 (32)
Which of the following conditions indicate cost minimization, assuming two inputs, labour (L) and capital (K)?
(Multiple Choice)
4.9/5 (43)
Increasing returns to scale for a firm is shown graphically by
(Multiple Choice)
4.9/5 (27)
The figure below shows the isocost lines and the isoquant map for a firm producing golf tees. 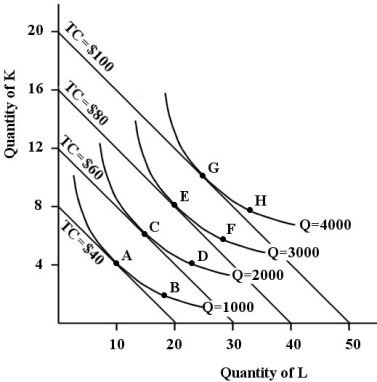 FIGURE 8-6
-Refer to Figure 8-6. As this firm is increasing its production of golf tees, it is experiencingreturns to scale.
FIGURE 8-6
-Refer to Figure 8-6. As this firm is increasing its production of golf tees, it is experiencingreturns to scale.
(Multiple Choice)
4.7/5 (34)
The figure below shows a family of cost curves for a firm. The subscripts 1, 2, and 3 for the SRATC curves refer to different plant sizes. 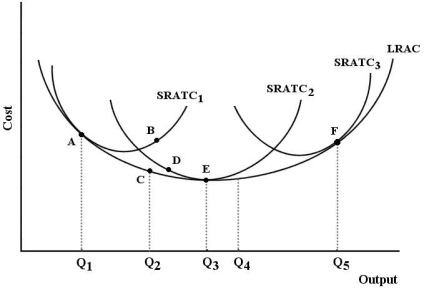 FIGURE 8-3
-"The bigger the volume, the lower the cost, and we pass these savings on to you" is a familiar advertising slogan. It implies essentially that the
FIGURE 8-3
-"The bigger the volume, the lower the cost, and we pass these savings on to you" is a familiar advertising slogan. It implies essentially that the
(Multiple Choice)
4.8/5 (42)
Consider a firm that uses only labour and capital as inputs. At the present use of labour and capital, the MP of labour is four times the MP of capital, and the price of labour is twice the price of capital. In order to minimize its costs, the firm should
(Multiple Choice)
4.9/5 (33)
By expressing the cost-minimizing condition as MPK/MPL = PK/PL, we are able to see 68)
(Multiple Choice)
4.9/5 (33)
Suppose a firm employs two kinds of inputs, capital at $100 per unit, and labour at $25 per unit. If the marginal product of capital is 50, then the firm should in order to minimize its production costs.
(Multiple Choice)
4.8/5 (44)
The figure below shows the isocost lines facing a firm producing golf tees. 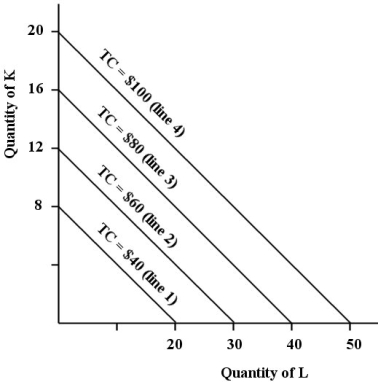 FIGURE 8-5
-Refer to Figure 8-5. is equal to
FIGURE 8-5
-Refer to Figure 8-5. is equal to
(Multiple Choice)
4.8/5 (43)
The table below shows the number of units of labour and capital used in 4 alternative production techniques for producing 1000 widgets per month. 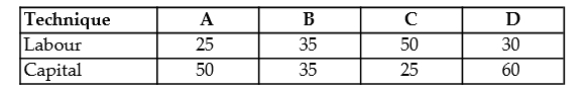 TABLE 8-1
-Refer to Table 8-1. If the price of labour is $10 and the price of capital is $5, which production technique minimizes the costs of producing 1000 units of output?
TABLE 8-1
-Refer to Table 8-1. If the price of labour is $10 and the price of capital is $5, which production technique minimizes the costs of producing 1000 units of output?
(Multiple Choice)
4.7/5 (40)
Filters
- Essay(0)
- Multiple Choice(0)
- Short Answer(0)
- True False(0)
- Matching(0)