Exam 8: Producers in the Long Run
Exam 1: Economic Issues and Concepts88 Questions
Exam 2: Economic Theories, Data, and Graphs96 Questions
Exam 3: Demand, Supply, and Price98 Questions
Exam 4: Elasticity94 Questions
Exam 5: Markets in Action65 Questions
Exam 6: Consumer Behaviour77 Questions
Exam 7: Producers in the Short Run75 Questions
Exam 8: Producers in the Long Run107 Questions
Exam 9: Competitive Markets90 Questions
Exam 10: Monopoly, Cartels, and Price Discrimination79 Questions
Exam 11: Imperfect Competition95 Questions
Exam 12: Economic Efficiency and Public Policy96 Questions
Select questions type
The figure below shows a family of cost curves for a firm. The subscripts 1, 2, and 3 for the SRATC curves refer to different plant sizes.  FIGURE 8-3
-Suppose that capital costs $50 per unit and labour costs $20 per unit. If the marginal product of capital is 100 and the marginal product of labour is 30, a cost-minimizing firm should
FIGURE 8-3
-Suppose that capital costs $50 per unit and labour costs $20 per unit. If the marginal product of capital is 100 and the marginal product of labour is 30, a cost-minimizing firm should
(Multiple Choice)
4.8/5  (45)
(45)
In the long run, a profit-maximizing firm produces any given level of output by choosing the production method that
(Multiple Choice)
4.9/5 (39)
Movement from one point to another along an isocost line implies a change in
(Multiple Choice)
4.7/5 (38)
Suppose that capital costs $6 per unit and labour costs $3 per unit. If the marginal product ofcapital is 3 and the marginal product of labour is 6, the cost-minimizing firm should
(Multiple Choice)
4.8/5 (42)
Suppose that capital costs $6 per unit and labour costs $3 per unit. If the marginal product ofcapital is 12 and the marginal product of labour is 6, the cost-minimizing firm should
(Multiple Choice)
4.8/5 (39)
The figure below shows the isocost lines facing a firm producing golf tees. 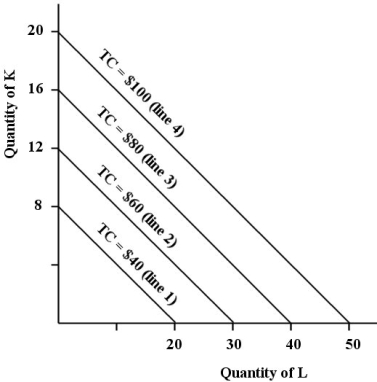 FIGURE 8-5
-Refer to Figure 8-4. The firm is initially producing 1000 units and minimizing its production cost at point B. Suppose the prices of capital and labour each fall by 20 percent. If the firm wishes to continue producing the same level of output it will
FIGURE 8-5
-Refer to Figure 8-4. The firm is initially producing 1000 units and minimizing its production cost at point B. Suppose the prices of capital and labour each fall by 20 percent. If the firm wishes to continue producing the same level of output it will
(Multiple Choice)
4.7/5 (36)
The figure below shows a family of cost curves for a firm. The subscripts 1, 2, and 3 for the SRATC curves refer to different plant sizes. 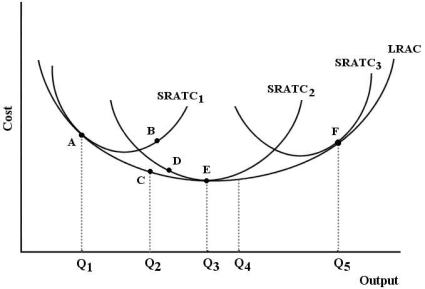 FIGURE 8-3
-Refer to Figure 8-3. If this firm is producing at point B, then
FIGURE 8-3
-Refer to Figure 8-3. If this firm is producing at point B, then
(Multiple Choice)
4.8/5 (34)
Consider a firm that uses only labour and capital. At the present use of labour and capital, the MP of labour is two times the MP of capital, and the price of labour is two times the price of capital. In order to minimize its costs, the firm should
(Multiple Choice)
4.8/5 (42)
The table below shows the number of units of labour and capital used in 4 alternative production techniques for producing 1000 widgets per month. 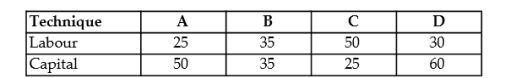 TABLE 8-1
-Canada has a much lower population density than does Japan. Therefore, the price of land (relative to the price of labour) is lower in Canada than in Japan. Consider a Canadian firm and a Japanese firm, both producing rice, both having access to the same technologies, and both striving to minimize their costs. The Canadian firm will use the two inputs, land and labour, in such a waythat its land/labour ratio is
TABLE 8-1
-Canada has a much lower population density than does Japan. Therefore, the price of land (relative to the price of labour) is lower in Canada than in Japan. Consider a Canadian firm and a Japanese firm, both producing rice, both having access to the same technologies, and both striving to minimize their costs. The Canadian firm will use the two inputs, land and labour, in such a waythat its land/labour ratio is
(Multiple Choice)
4.9/5 (31)
The figure below shows a family of cost curves for a firm. The subscripts 1, 2, and 3 for the SRATC curves refer to different plant sizes. FIGURE 8-3
-Refer to Figure 8-3. Should this firm ever consider moving from point E (output level Q₃ onSRATC2) to point F (output level Q5 on SRATC3)?
(Multiple Choice)
4.9/5 (35)
The principle of substitution plays a central role in resource allocation because it demonstrates that
(Multiple Choice)
4.9/5 (45)
A firm operates at its least-cost position for a given level of output by equating
(Multiple Choice)
4.8/5 (41)
The figure below shows the isocost lines and the isoquant map for a firm producing golf tees. 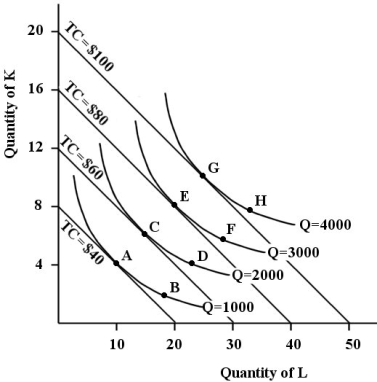 FIGURE 8-6
-Refer to Figure 8-6. Suppose the firm is currently producing at point E and the prices of capital and labour each increase by 30 percent. If the firm wants to minimize the cost of producing the same level of output, the firm's chosen factor combination would be at point
FIGURE 8-6
-Refer to Figure 8-6. Suppose the firm is currently producing at point E and the prices of capital and labour each increase by 30 percent. If the firm wants to minimize the cost of producing the same level of output, the firm's chosen factor combination would be at point
(Multiple Choice)
4.7/5 (36)
The table below shows the number of units of labour and capital used in 4 alternative production techniques for producing 1000 widgets
per month. 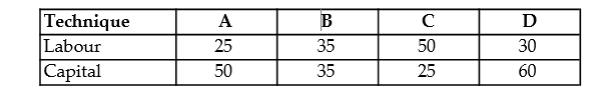 TABLE 8-1
-Which of the following is unlikely to be a source of increasing productivity?
TABLE 8-1
-Which of the following is unlikely to be a source of increasing productivity?
(Multiple Choice)
4.8/5 (36)
A change in the technique for producing an existing product is known as
(Multiple Choice)
4.9/5 (47)
The long-run average cost curve is an envelope curve, with each point associated with a short-run average cost curve
(Multiple Choice)
4.9/5 (41)
The table below shows the number of units of labour and capital used in 4 alternative production techniques for producing 1000 widgets per month. TABLE 8-1
-Suppose that capital costs $10 per unit and labour costs $5 per unit. For a profit-maximizing firm operating at its optimal factor mix, if the marginal product of capital is 50, the marginal product of labour must be .
(Multiple Choice)
4.8/5 (39)
Filters
- Essay(0)
- Multiple Choice(0)
- Short Answer(0)
- True False(0)
- Matching(0)