Exam 8: Producers in the Long Run
Exam 1: Economic Issues and Concepts88 Questions
Exam 2: Economic Theories, Data, and Graphs96 Questions
Exam 3: Demand, Supply, and Price98 Questions
Exam 4: Elasticity94 Questions
Exam 5: Markets in Action65 Questions
Exam 6: Consumer Behaviour77 Questions
Exam 7: Producers in the Short Run75 Questions
Exam 8: Producers in the Long Run107 Questions
Exam 9: Competitive Markets90 Questions
Exam 10: Monopoly, Cartels, and Price Discrimination79 Questions
Exam 11: Imperfect Competition95 Questions
Exam 12: Economic Efficiency and Public Policy96 Questions
Select questions type
In the long run, a profit-maximizing firm producing a given level of output chooses the productionmethod that
(Multiple Choice)
5.0/5  (35)
(35)
Which of the following paired concepts are equivalent to each other?
(Multiple Choice)
4.7/5 (37)
The following table shows the marginal products of capital (K) and labour (L) for various methods for Firm ABC to produce 1000 toys per day. 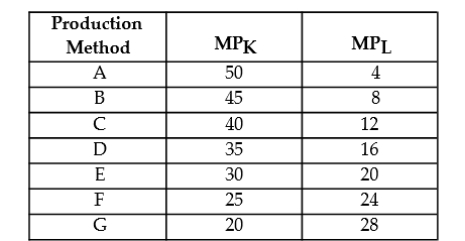 TABLE 8-2
-Refer to Table 8-2. If capital costs $6 per unit and labour costs $4 per unit, which production method minimizes the cost of producing 1000 toys per day?
TABLE 8-2
-Refer to Table 8-2. If capital costs $6 per unit and labour costs $4 per unit, which production method minimizes the cost of producing 1000 toys per day?
(Multiple Choice)
4.8/5 (42)
A firm's least-cost position for producing a given output level occurs at that point where
(Multiple Choice)
4.8/5 (40)
The following table shows the marginal products of capital (K) and labour (L) for various methods for Firm ABC to produce 1000 toys per day. 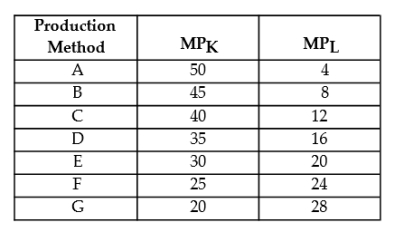 TABLE 8-2
-Refer to Table 8-2. Suppose capital costs $80 per unit and labour costs $24 per unit. Which production method minimizes the cost of producing 1000 toys per day.
TABLE 8-2
-Refer to Table 8-2. Suppose capital costs $80 per unit and labour costs $24 per unit. Which production method minimizes the cost of producing 1000 toys per day.
(Multiple Choice)
4.9/5 (27)
Assume a firm is using 10 units of capital and 10 units of labour and is producing 10 widgets per hour. Now it doubles both inputs, resulting in output of 30 widgets per hour. This firm is experiencing
(Multiple Choice)
4.8/5 (38)
Suppose a firm experiences decreasing returns to scale. This is shown graphically by
(Multiple Choice)
4.9/5 (38)
Suppose that a firm is using 100 units of labour and 50 units of capital to produce 200 fax machines per day. The price of labour is $10 per unit and the price of capital is $5 per unit. The MPL equals 2 and the MPK equals 5. In this situation,
(Multiple Choice)
5.0/5 (44)
Refer to Figure 8-1. For which of the four firms would the family of short-run average total cost curves lie below the LRAC?
(Multiple Choice)
4.9/5 (28)
The figure below shows a family of cost curves for a firm. The subscripts 1, 2, and 3 for the SRATC curves refer to different plant sizes. 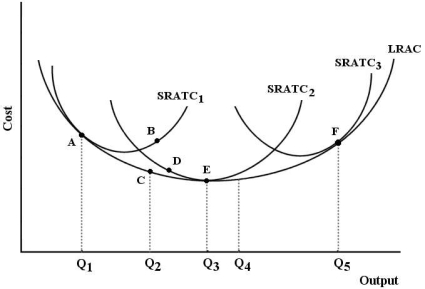 FIGURE 8-3
-Refer to Figure 8-3. Suppose this firm is producing output level Q₃ with plant size 2. Now suppose this firm changes to plant size 3 and is producing output level Q5. We can say that
FIGURE 8-3
-Refer to Figure 8-3. Suppose this firm is producing output level Q₃ with plant size 2. Now suppose this firm changes to plant size 3 and is producing output level Q5. We can say that
(Multiple Choice)
4.9/5 (36)
A short-run average total cost curve will touch the long-run average cost curve at a level of outputonly
(Multiple Choice)
4.8/5 (33)
The figure below shows the isocost lines and the isoquant map for a firm producing golf tees.  FIGURE 8-6
-Refer to Figure 8-6. Suppose this firm is producing 4000 golf tees with 10 units of capital and 25 units of labour. The marginal rate of substitution between capital and labour is
FIGURE 8-6
-Refer to Figure 8-6. Suppose this firm is producing 4000 golf tees with 10 units of capital and 25 units of labour. The marginal rate of substitution between capital and labour is
(Multiple Choice)
4.9/5 (38)
The figure below shows the isocost lines facing a firm producing golf tees. 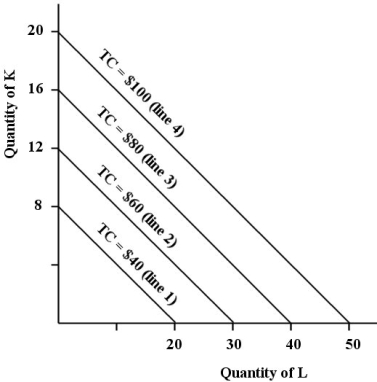 FIGURE 8-5
-Refer to Figure 8-5. If the cost-minimizing firm is initially producing at a point on isocost line 1 and then moves to a point on isocost line 3, we can say that
FIGURE 8-5
-Refer to Figure 8-5. If the cost-minimizing firm is initially producing at a point on isocost line 1 and then moves to a point on isocost line 3, we can say that
(Multiple Choice)
4.7/5 (34)
The figure below shows the isocost lines and the isoquant map for a firm producing golf tees. 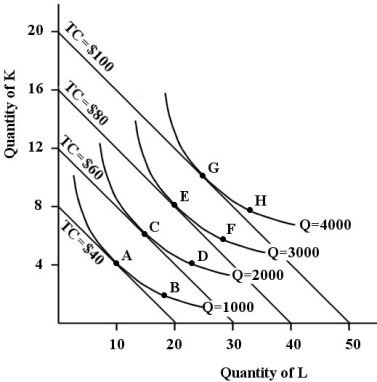 FIGURE 8-6
-Refer to Figure 8-6. Suppose this firm is producing 3000 golf tees and is at point F on the isoquant map. Which of the following is true?
FIGURE 8-6
-Refer to Figure 8-6. Suppose this firm is producing 3000 golf tees and is at point F on the isoquant map. Which of the following is true?
(Multiple Choice)
4.8/5 (29)
The table below shows the number of units of labour and capital used in 4 alternative production techniques for producing 1000 widgets per month. 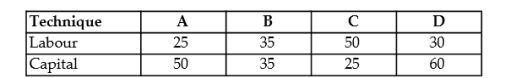 TABLE 8-1
-Which of the following statements concerning long-run and short-run cost curves is correct?
TABLE 8-1
-Which of the following statements concerning long-run and short-run cost curves is correct?
(Multiple Choice)
4.9/5 (40)
The fact that new methods to extract oil are developed as oil prices increase suggests
(Multiple Choice)
4.8/5 (36)
A firm trying to maximize its profits in the long run should
(Multiple Choice)
4.7/5 (31)
For a firm with only two inputs, capital and labour, the condition MPK/MPL = PK/PL guarantees that the firm is
(Multiple Choice)
4.8/5 (37)
The figure below shows a family of cost curves for a firm. The subscripts 1, 2, and 3 for the SRATC curves refer to different plant sizes.  FIGURE 8-3
-Refer to Figure 8-3. The difference between the SRATC curves and the LRAC curve is that
FIGURE 8-3
-Refer to Figure 8-3. The difference between the SRATC curves and the LRAC curve is that
(Multiple Choice)
4.8/5 (31)
Filters
- Essay(0)
- Multiple Choice(0)
- Short Answer(0)
- True False(0)
- Matching(0)