Exam 2: Functions, Limits and the Derivative
Exam 1: Preliminaries209 Questions
Exam 2: Functions, Limits and the Derivative271 Questions
Exam 3: Differentiation331 Questions
Exam 4: Applications of the Derivative183 Questions
Exam 5: Exponential and Logarithmic Functions278 Questions
Exam 6: Integration313 Questions
Exam 7: Additional Topics in Integration250 Questions
Exam 8: Calculus of Several Variables205 Questions
Select questions type
Joan is looking straight out a window of an apartment building at a height of 30 ft from the ground.A boy throws a tennis ball straight up by the side of the building where the window is located.Suppose the height of the ball (measured in feet) from the ground at time t is 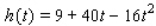 At what time(s) does the ball cross Joan's line of sight?
(Essay)
4.9/5  (31)
(31)
For the supply equations, where x is the quantity supplied in units of a thousand and p is the unit price in dollars, sketch the supply curve. 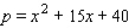
(Multiple Choice)
4.8/5 (31)
The position of car A and car B, starting out side by side and traveling along a straight road, is given by  and
and  , respectively, where s is measured in feet and t is measured in seconds (see the accompanying figure).
 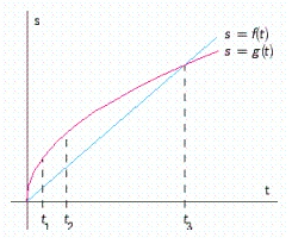 Which car is traveling faster at
  ?
?
(Multiple Choice)
4.7/5 (38)
Entomologists have discovered that a linear relationship exists between the number of chirps of crickets of a certain species and the air temperature.When the temperature is  the crickets chirp at the rate of 80 times/minute, and when the temperature is
  they chirp at the rate of 160 times/minute.Find an equation giving the relationship between the air temperature T and the number of chirps/minute N of the crickets.
(Multiple Choice)
4.8/5 (29)
Experiments conducted by
A.J.Clark suggest that the response R(x) of a frog's heart muscle to the injection of x units of acetylcholine (as a percent of the maximum possible effect of the drug) may be approximated by the rational function
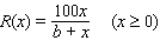 where b is a positive constant that depends on the particular frog.If a concentration of 40 units of acetylcholine produces a response of 40% for a certain frog, find the "response function" for this frog.
(Essay)
4.8/5 (43)
The function P, whose graph follows, gives the prime rate (the interest rate banks charge their best corporate customers) as a function of time for the first 32 wk during a year.Determine the values of t for which P is discontinuous. 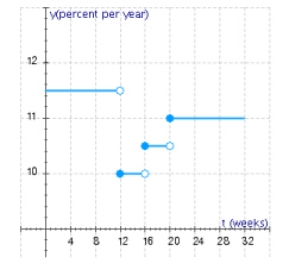
 __________
(Essay)
4.8/5 (36)
For the supply equation 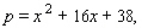 where x is the quantity supplied in units of a thousand and p is the unit price in dollars, determine the price at which the supplier will make 3 units of the commodity available in the market.
(Multiple Choice)
4.8/5 (34)
The revenue (in dollars) realized by Apollo from the sale of its inkjet printers is given by 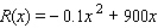 where x denotes the number of units manufactured each month.What is Apollo's revenue when 2,000 units are produced?
$__________
where x denotes the number of units manufactured each month.What is Apollo's revenue when 2,000 units are produced?
$__________
(Short Answer)
4.8/5 (35)
An apple orchard has an average yield of 37 bushels of apples/tree if tree density is 22 trees/acre.For each unit increase in tree density, the yield decreases by 3 bushels.Letting x denote the number of trees beyond 22/acre, find a function in x that gives the yield of apples.
(Multiple Choice)
5.0/5 (36)
The position of car A and car B, starting out side by side and traveling along a straight road, is given by  and
and  , respectively, where s is measured in feet and t is measured in seconds (see the accompanying figure).
 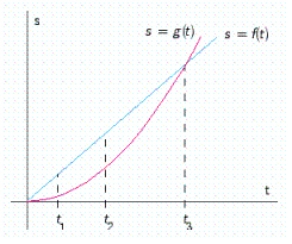 Which car is traveling faster at
  ?
Car __________
Which car is traveling faster at
?
Car __________
Which car is traveling faster at  ?
Hint: Compare tangent lines.
Car __________
Which car is traveling faster at
?
Hint: Compare tangent lines.
Car __________
Which car is traveling faster at  ?
Car __________
?
Car __________
(Essay)
4.8/5 (30)
Use the four-step process to find the slope of the tangent line to the graph of the given function at any point. 
 __________
(Essay)
4.8/5 (46)
Use the graph of the given function f to determine  at the indicated value of a, if it exists.
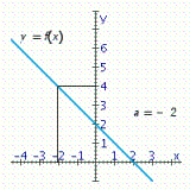
(Multiple Choice)
4.9/5 (35)
Productivity and yield of cultivated crops are often reduced by insect pests.The following graph shows the relationship between the yield of a certain crop,  , as a function of the density of aphids x.(Aphids are small insects that suck plant juices.) Here,
  is measured in kilograms/ 4,000 square meters, and x is measured in hundreds of aphids/bean stem.By computing the slopes of the respective tangent lines, estimate the rate of change of the crop yield with respect to the density of aphids when that density is 200 aphids/bean stem and when it is 800 aphids/bean stem.
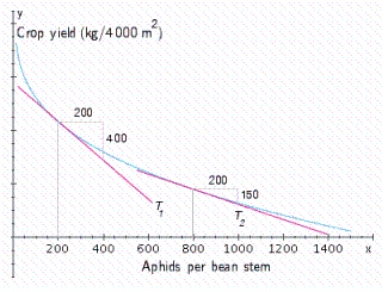
(Multiple Choice)
4.9/5 (36)
Determine all values of x at which the function is discontinuous. 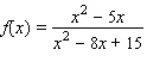
(Multiple Choice)
5.0/5 (42)
Determine all values of x at which the function is discontinuous. 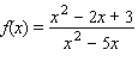
(Multiple Choice)
4.8/5 (29)
Filters
- Essay(0)
- Multiple Choice(0)
- Short Answer(0)
- True False(0)
- Matching(0)