Exam 15: Multinationals and Migration: International Factor Movements
Exam 1: International Economics Is Different60 Questions
Exam 2: The Basic Theory Using Demand and Supply60 Questions
Exam 3: Why Everybody Trades: Comparative Advantage59 Questions
Exam 4: Trade: Factor Availability and Factor Proportions Are Key48 Questions
Exam 5: Who Gains and Who Loses From Trade60 Questions
Exam 6: Scale Economies, Imperfect Competition, and Trade59 Questions
Exam 7: Growth and Trade Part II: Trade Policy60 Questions
Exam 8: Analysis of a Tariff60 Questions
Exam 9: Nontariff Barriers to Imports60 Questions
Exam 10: Arguments for and Against Protection60 Questions
Exam 11: Pushing Exports52 Questions
Exam 12: Trade Blocs and Trade Blocks60 Questions
Exam 13: Trade and the Environment60 Questions
Exam 14: Trade Policies for Developing Countries60 Questions
Exam 15: Multinationals and Migration: International Factor Movements60 Questions
Exam 16: Payments Among Nations60 Questions
Exam 17: The Foreign Exchange Market56 Questions
Exam 18: Forward Exchange and International Financial Investment60 Questions
Exam 19: What Determines Exchange Rates44 Questions
Exam 20: Government Policies Toward the Foreign Exchange Market56 Questions
Exam 21: International Lending and Financial Crises60 Questions
Exam 22: How Does the Open Macroeconomy Work59 Questions
Exam 23: Internal and External Balance With Fixed Exchange Rates59 Questions
Exam 24: Floating Exchange Rates and Internal Balance60 Questions
Exam 25: National and Global Choices: Floating Rates and the Alternatives60 Questions
Select questions type
Countries that grow the fastest are those that adopt inward-oriented policies toward trade and foreign direct investment.
(True/False)
4.8/5  (36)
(36)
The figure given below represents the effects in the labor markets due to migration. Here the world has been divided into a high-income "North" (left panel) and a low-income "South" (right panel). Dn and Sn are the labor demand and the labor supply curves in North. Ds and (Sr + Smig) are the labor demand and pre-migration labor supply curves in South. Sr is the post-migration labor supply curve in South. The value c is the cost of migrating. 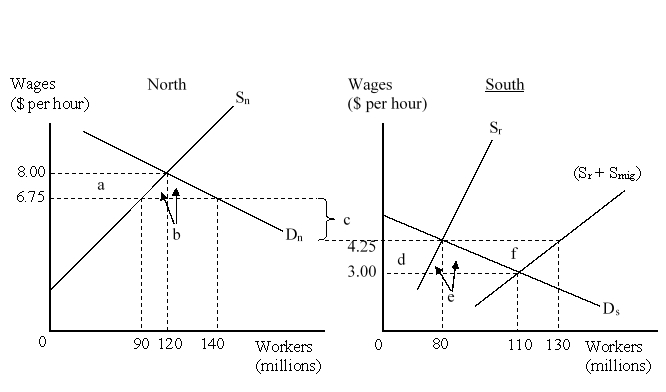 When migration is not allowed, workers in North earn _____ per hour and workers in South earn _____ per hour.
(Multiple Choice)
4.9/5 (38)
Which of the following is a likely impact of international migration?
(Multiple Choice)
4.9/5 (27)
Which of the following statements is true concerning the global flow of FDI since 1990?
(Multiple Choice)
4.8/5 (41)
In the case in which foreign affiliates undertake the same kind of production as the parent firm, the affiliate _____ some trade in that product. The affiliate also _____ trade through better local marketing of other products produced by the multinational in other countries.
(Multiple Choice)
4.7/5 (38)
Should receiving countries ban all forms of immigration because non-immigrant workers in the receiving country are hurt by immigration? Discuss.
(Essay)
4.8/5 (35)
FDI outflows have a positive impact on workers in the home country.
(True/False)
4.9/5 (38)
A firm that owns and controls operations in more than one country is a(n):
(Multiple Choice)
4.9/5 (40)
Which of the following was among the policies that the Chinese government began to implement since 2006?
(Multiple Choice)
4.7/5 (37)
If movement of labor across countries is costless and painless, it can be expected that:
(Multiple Choice)
4.8/5 (38)
In 2007-2011 China was the largest recipient of direct investment flows in the world.
(True/False)
4.8/5 (39)
The figure given below represents the effects in the labor markets due to migration. Here the world has been divided into a high-income "North" (left panel) and a low-income "South" (right panel). Dn and Sn are the labor demand and the labor supply curves in North. Ds and (Sr + Smig) are the labor demand and pre-migration labor supply curves in South. Sr is the post-migration labor supply curve in South. The value c is the cost of migrating. 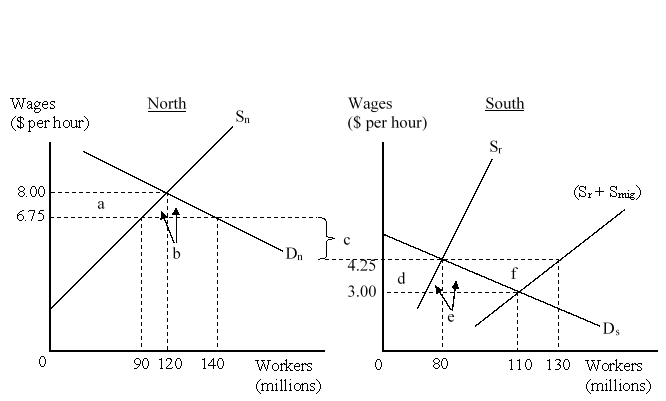 As a result of migration, the employers in North:
(Multiple Choice)
4.9/5 (35)
Historically, the U.S. firms have shown less of a preference for FDI and management control than have firms from other investing countries.
(True/False)
4.8/5 (27)
Political risk is the possibility that the government of the host country will alter its policies in ways that harm the multinational enterprise.
(True/False)
4.9/5 (34)
The figure given below represents the effects in the labor markets due to migration. Here the world has been divided into a high-income "North" (left panel) and a low-income "South" (right panel). Dn and Sn are the labor demand and the labor supply curves in North. Ds and (Sr + Smig) are the labor demand and pre-migration labor supply curves in South. Sr is the post-migration labor supply curve in South. The value c is the cost of migrating. 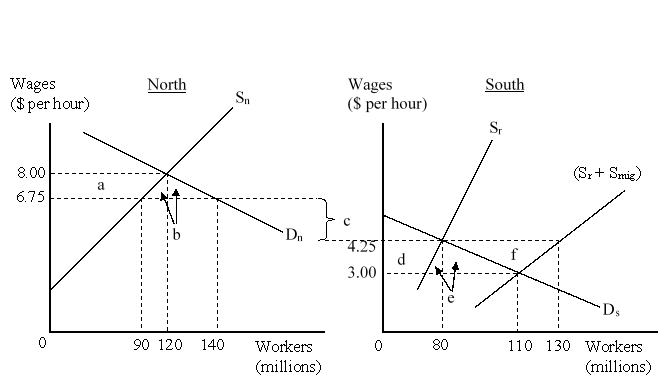 The world's net gain due to migration is represented by the area:
(Multiple Choice)
4.8/5 (37)
The figure given below represents the effects in the labor markets due to migration. Here the world has been divided into a high-income "North" (left panel) and a low-income "South" (right panel). Dn and Sn are the labor demand and the labor supply curves in North. Ds and (Sr + Smig) are the labor demand and pre-migration labor supply curves in South. Sr is the post-migration labor supply curve in South. The value c is the cost of migrating. 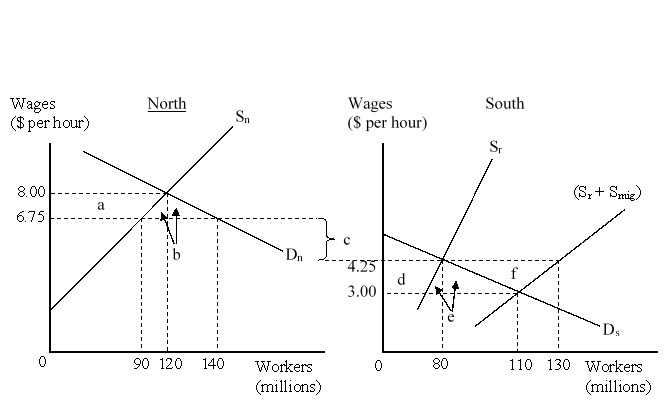 The migration cost on a per hour basis is:
(Multiple Choice)
4.7/5 (32)
In the past three decades many developing countries have shifted away from restricting FDI inflows to encouraging them.
(True/False)
4.8/5 (39)
Filters
- Essay(0)
- Multiple Choice(0)
- Short Answer(0)
- True False(0)
- Matching(0)