Exam 2: Frequency Distributions
Exam 1: Introduction to Statistics70 Questions
Exam 2: Frequency Distributions70 Questions
Exam 3: Central Tendency70 Questions
Exam 4: Variability70 Questions
Exam 5: Z-Scores40 Questions
Exam 6: Probability69 Questions
Exam 7: The Distribution of Sample Means69 Questions
Exam 8: Introduction to Hypothesis Testing69 Questions
Exam 9: Introduction to the T Statistic68 Questions
Exam 10: The T Test for Two Independent Samples70 Questions
Exam 11: The T Test for Two Related Samples69 Questions
Exam 12: Introduction to Analysis of Variance70 Questions
Exam 13: Repeated-Measures Anova70 Questions
Exam 14: Two-Factor Analysis of Variance70 Questions
Exam 15: Correlation70 Questions
Exam 16: Introduction to Regression70 Questions
Exam 17: Chi-Square Tests70 Questions
Exam 18: The Binomial Test70 Questions
Exam 19: Choosing the Right Statistics4 Questions
Select questions type
For the following distribution, what is the width of each class interval? X f 20-24 2 15-19 5 10-14 4 5-9 1
(Multiple Choice)
4.7/5  (44)
(44)
In the following distribution, the scores are grouped into class intervals that are each 5 points wide. 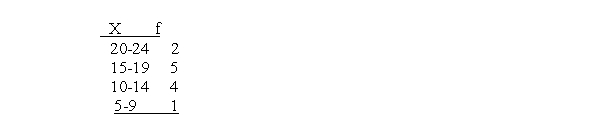
(True/False)
4.8/5 (34)
What kind of frequency distribution graph shows the frequencies as bars, with no space between adjacent bars?
(Multiple Choice)
4.8/5 (30)
A group of quiz scores ranges from 3 to 10, but no student had a score of X = 5.If the scores are put in a frequency distribution table, X = 5 would not be listed in the X column.
(True/False)
4.8/5 (36)
In a grouped frequency distribution table, the top value in each class interval should be a multiple of the interval width.
(True/False)
4.8/5 (35)
If a set of exam scores forms a negatively skewed distribution, it suggests that the majority of the students did not score well on the exam.
(True/False)
4.9/5 (46)
For the distribution in the following table, what is the percentile rank for X = 8.5? X C/0 9 100\% 8 80\% 7 50\% 6 25\%
(Multiple Choice)
4.8/5 (41)
In February in New York, the daily high temperatures are typically low with only a few relatively warm days.A frequency distribution showing the daily high temperatures would probably form a negatively skewed distribution.
(True/False)
4.7/5 (34)
For the distribution in the following table, what is the percentile rank for X = 7?
X C/0 9 100\% 8 80\% 7 50\% 6 25\%
(Multiple Choice)
4.9/5 (43)
A researcher records the number of traffic tickets issued in each county along the New York State thruway.If the results are presented in a frequency distribution graph, what kind of graph should be used?
(Multiple Choice)
4.8/5 (34)
For the following distribution of scores, X2 = 92. X f 4 1 3 2 2 3 1 2
(True/False)
4.7/5 (37)
What frequency distribution graph is appropriate for scores measured on a nominal scale?
(Multiple Choice)
4.9/5 (34)
For the scores shown in the following stem and leaf display, what is the highest score in the distribution? 8 314 7 945 6 7042 5 68 4 14
(Multiple Choice)
4.9/5 (43)
If a set of exam scores forms a symmetrical distribution, what can you conclude about the students scores?
(Multiple Choice)
4.9/5 (34)
A researcher surveys a sample of n = 200 college students and asks each person to identify his or her favorite movie from the past year.If the results are presented in a frequency distribution graph, the researcher should use a bar graph.
(True/False)
4.9/5 (33)
For the following frequency distribution of quiz scores, how many individuals took the quiz?
X f 5 6 4 5 3 5 2 3 1 2
(Multiple Choice)
4.9/5 (44)
For the distribution in the following table, what is the 50th percentile? Y 0/0 9 100\% 8 80\% 7 50\% 6 250/0
(Multiple Choice)
4.8/5 (43)
If it is appropriate to present a distribution of scores in a polygon, then it would also be appropriate to present the scores in a bar graph.
(True/False)
4.8/5 (37)
Filters
- Essay(0)
- Multiple Choice(0)
- Short Answer(0)
- True False(0)
- Matching(0)