Exam 2: Frequency Distributions
Exam 1: Introduction to Statistics70 Questions
Exam 2: Frequency Distributions70 Questions
Exam 3: Central Tendency70 Questions
Exam 4: Variability70 Questions
Exam 5: Z-Scores40 Questions
Exam 6: Probability69 Questions
Exam 7: The Distribution of Sample Means69 Questions
Exam 8: Introduction to Hypothesis Testing69 Questions
Exam 9: Introduction to the T Statistic68 Questions
Exam 10: The T Test for Two Independent Samples70 Questions
Exam 11: The T Test for Two Related Samples69 Questions
Exam 12: Introduction to Analysis of Variance70 Questions
Exam 13: Repeated-Measures Anova70 Questions
Exam 14: Two-Factor Analysis of Variance70 Questions
Exam 15: Correlation70 Questions
Exam 16: Introduction to Regression70 Questions
Exam 17: Chi-Square Tests70 Questions
Exam 18: The Binomial Test70 Questions
Exam 19: Choosing the Right Statistics4 Questions
Select questions type
In a grouped frequency distribution table, one interval is identified as 30-34.This interval has a width of 5 points.
(True/False)
4.9/5  (34)
(34)
What kind of frequency distribution graph shows the frequencies as bars that are separated by spaces?
(Multiple Choice)
4.8/5 (35)
In a frequency distribution graph, frequencies are presented on the and the scores (categories) are listed on the .
(Multiple Choice)
4.8/5 (36)
For the distribution in the following table, what is the 90th percentile 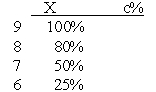
(Multiple Choice)
4.9/5 (36)
For the distribution in the following table, the 80th percentile is X = 24. 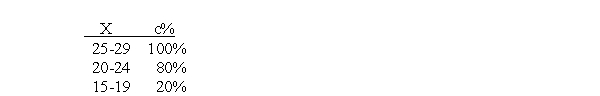
(True/False)
4.8/5 (37)
For the distribution in the following table, what is the 90th percentile? \% 30-34 100\% 25-29 90\% 20-24 60\% 15-19 20\%
(Multiple Choice)
5.0/5 (45)
For the distribution in the following table, what is the percentile rank for X = 32? X C\% 30-34 100\% 25-29 90\% 20-24 60\% 15-19 20\%
(Multiple Choice)
4.8/5 (42)
What is the shape of the distribution for the following set of data? Scores: 1, 2, 3, 3, 4, 4, 4 5, 5, 5, 5, 6
(Multiple Choice)
4.9/5 (38)
A professor records the number of students who are absent each day for the semester.Because this is a discrete variable, a bar graph should be used to show the frequency distribution.
(True/False)
4.8/5 (47)
A skewed distribution typically has _____ tail(s) and a normal distribution has ____ tail(s).
(Multiple Choice)
4.8/5 (32)
A set of scores ranges from X = 18 to X= 91.If the scores are put in a grouped frequency distribution table with an interval width of 10 points, the top interval would be 91-100.
(True/False)
4.9/5 (39)
For the following distribution of quiz scores, if a score of X = 3 or higher is needed for a passing grade, how many individuals passed? X f 5 6 4 5 3 5 2 3 1 2
(Multiple Choice)
4.8/5 (30)
For the following distribution of scores, 20% of the individuals have scores of X = 1. 5 2 4 8 3 5 2 3 1 2
(True/False)
5.0/5 (29)
A grouped frequency distribution table does not provide enough information to obtain a complete listing of the original set of scores.
(True/False)
4.8/5 (35)
A set of scores ranges from a low of X = 18 to a high of X = 98.If the scores are put in a grouped frequency distribution table with an interval width of 10 points, the bottom interval should be 10-19.
(True/False)
4.7/5 (40)
What is the total number of scores for the distribution shown in the following table?
X f 4 3 3 5 2 4 1 2
(Multiple Choice)
4.8/5 (43)
There is a total of n = 5 scores in the distribution shown in the following table. X f 5 2 4 8 3 5 2 3 1 2
(True/False)
4.9/5 (39)
If the following distribution was shown in a histogram, the bar above the 15-19 interval would reach from _____ to _____. 20-25 2 15-19 5 10-14 4 5-9 1
(Multiple Choice)
4.8/5 (35)
For the following distribution, what is the highest score? X f 20-25 2 15-19 5 10-14 4 5-9 1
(Multiple Choice)
5.0/5 (40)
What scale of measurement was used to measure the scores in the distribution shown in the following graph? 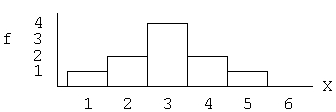
(Multiple Choice)
4.8/5 (36)
Filters
- Essay(0)
- Multiple Choice(0)
- Short Answer(0)
- True False(0)
- Matching(0)