Exam 2: Frequency Distributions
Exam 1: Introduction to Statistics70 Questions
Exam 2: Frequency Distributions70 Questions
Exam 3: Central Tendency70 Questions
Exam 4: Variability70 Questions
Exam 5: Z-Scores40 Questions
Exam 6: Probability69 Questions
Exam 7: The Distribution of Sample Means69 Questions
Exam 8: Introduction to Hypothesis Testing69 Questions
Exam 9: Introduction to the T Statistic68 Questions
Exam 10: The T Test for Two Independent Samples70 Questions
Exam 11: The T Test for Two Related Samples69 Questions
Exam 12: Introduction to Analysis of Variance70 Questions
Exam 13: Repeated-Measures Anova70 Questions
Exam 14: Two-Factor Analysis of Variance70 Questions
Exam 15: Correlation70 Questions
Exam 16: Introduction to Regression70 Questions
Exam 17: Chi-Square Tests70 Questions
Exam 18: The Binomial Test70 Questions
Exam 19: Choosing the Right Statistics4 Questions
Select questions type
A stem and leaf display does not provide enough information to obtain a complete listing of the original set of scores.
(True/False)
4.7/5  (36)
(36)
For the following distribution, how many people had scores less than X = 19? 20-25 2 15-19 5 10-14 4 5-9 1
(Multiple Choice)
4.8/5 (33)
For the distribution in the following graph, what is the value of ΣX? 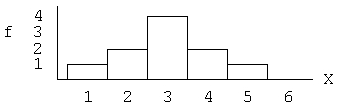
(Multiple Choice)
4.8/5 (41)
For the following distribution, how many people had scores greater than X = 14?
20-25 2 15-19 5 10-14 4 5-9 1
(Multiple Choice)
4.9/5 (34)
If a frequency distribution is shown in a bar graph, what scale was used to measure the scores?
(Multiple Choice)
4.7/5 (35)
For the distribution in the following table, what is the percentile rank for X = 24.5? 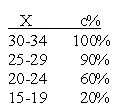
(Multiple Choice)
4.9/5 (36)
A grouped frequency distribution table lists one interval as, 20-29.The width of this interval is 9 points.
(True/False)
5.0/5 (25)
For the following frequency distribution of exam scores, what is the lowest score on the exam? 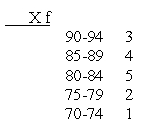
(Multiple Choice)
4.8/5 (32)
The normal distribution is an example of a symmetrical distribution.
(True/False)
4.7/5 (36)
For the following distribution of scores, X = 18. X f 4 1 3 2 2 3 1 2
(True/False)
4.8/5 (30)
Filters
- Essay(0)
- Multiple Choice(0)
- Short Answer(0)
- True False(0)
- Matching(0)