Exam 8: Applications: the Costs of Taxation
Exam 1: Ten Principles of Economics455 Questions
Exam 2: Thinking Like an Economist643 Questions
Exam 3: Interdependence and the Gains From Trade547 Questions
Exam 4: The Market Forces of Supply and Demand693 Questions
Exam 5: Elasticity and Its Application626 Questions
Exam 6: Supply, Demand, and Government Policies668 Questions
Exam 7: Consumers, Producers, and the Efficiency of Markets547 Questions
Exam 8: Applications: the Costs of Taxation509 Questions
Exam 9: Application: International Trade521 Questions
Exam 10: Externalities543 Questions
Exam 11: Public Goods and Common Resources452 Questions
Exam 12: The Design of the Tax System664 Questions
Exam 13: The Costs of Production649 Questions
Exam 14: Firms in Competitive Markets604 Questions
Exam 15: Monopoly662 Questions
Exam 16: Monopolistic Competition649 Questions
Exam 17: Oligopoly522 Questions
Exam 18: The Markets for the Factors of Production592 Questions
Exam 19: Earnings and Discrimination511 Questions
Exam 20: Income Inequality and Poverty478 Questions
Exam 21: The Theory of Consumer Choice570 Questions
Exam 22: Frontiers in Microeconomics461 Questions
Exam 23: Measuring a Nation S Income547 Questions
Exam 24: Measuring the Cost of Living565 Questions
Exam 25: Production and Growth527 Questions
Exam 26: Saving, Investment, and the Financial System637 Questions
Exam 27: Tools of Finance534 Questions
Exam 28: Unemployment and Its Natural Rate701 Questions
Exam 29: The Monetary System540 Questions
Exam 30: Money Growth and Inflation504 Questions
Exam 31: Open-Economy Macroeconomics: Basic Concepts540 Questions
Exam 32: A Macroeconomic Theory of the Open Economy511 Questions
Exam 33: Aggregate Demand and Aggregate Supply572 Questions
Exam 34: The Influence of Monetary and Fiscal Policy on Aggregate Demand523 Questions
Exam 35: The Short-Run Tradeoff Between Inflation and Unemployment536 Questions
Exam 36: Six Debates Over Macroeconomic Policy354 Questions
Select questions type
When a good is taxed, the tax revenue collected by the government equals the decrease in the welfare of buyers and sellers caused by the tax.
(True/False)
4.8/5  (43)
(43)
When a country is on the downward-sloping side of the Laffer curves, a cut in the tax rate will
(Multiple Choice)
4.7/5 (26)
Figure 8-23. The figure represents the relationship between the size of a tax and the tax revenue raised by that tax. 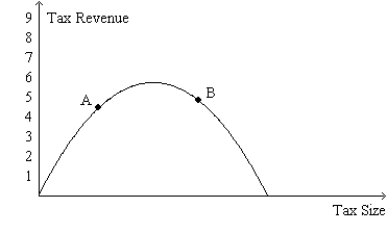 -Refer to Figure 8-23. If the economy is at point A on the curve, then a small increase in the tax rate will
(Multiple Choice)
4.8/5 (39)
Figure 8-13 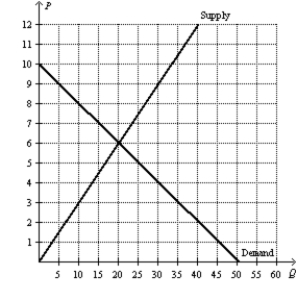 -Refer to Figure 8-13. Suppose the government places a $5 per-unit tax on this good. The per-unit burden of the tax on buyers is
(Multiple Choice)
4.8/5 (35)
Figure 8-13
-Refer to Figure 8-13. Suppose the government places a $5 per-unit tax on this good. The tax causes the price received by sellers to
(Multiple Choice)
4.8/5 (42)
Figure 8-7
The vertical distance between points A and B represents a tax in the market. 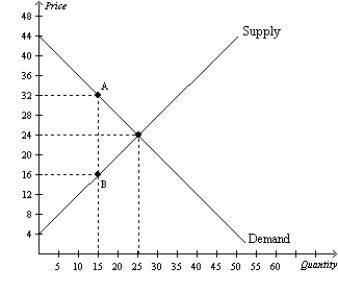 -Refer to Figure 8-7. Which of the following statements is correct?
(Multiple Choice)
4.9/5 (37)
Figure 8-19
The vertical distance between points A and B represents the original tax. 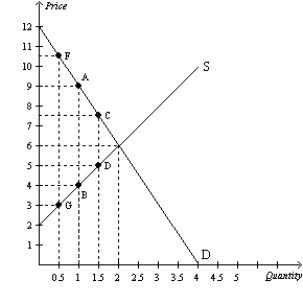 -Refer to Figure 8-19. The original tax can be represented by the vertical distance AB. Suppose the government is deciding whether to lower the tax to CD or raise it to FG. Which of the following statements is correct?
(Multiple Choice)
4.8/5 (38)
Figure 8-13
-Refer to Figure 8-13. Suppose the government places a $5 per-unit tax on this good. The loss of consumer surplus resulting from this tax is
(Multiple Choice)
4.9/5 (37)
As the size of a tax increases, the government's tax revenue rises, then falls.
(True/False)
4.8/5 (32)
Figure 8-9
The vertical distance between points A and C represents a tax in the market. 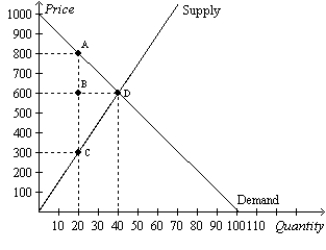 -Refer to Figure 8-9. The per-unit burden of the tax on sellers is
(Multiple Choice)
4.7/5 (42)
Figure 8-3
The vertical distance between points A and C represents a tax in the market. 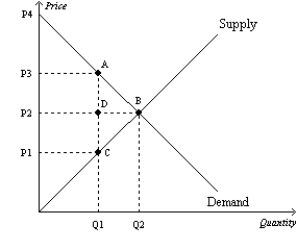 -Refer to Figure 8-3. The amount of tax revenue received by the government is equal to the area
(Multiple Choice)
4.7/5 (32)
Figure 8-3
The vertical distance between points A and C represents a tax in the market.
-Refer to Figure 8-3. The amount of the tax on each unit of the good is
(Multiple Choice)
4.7/5 (43)
Figure 8-6
The vertical distance between points A and B represents a tax in the market. 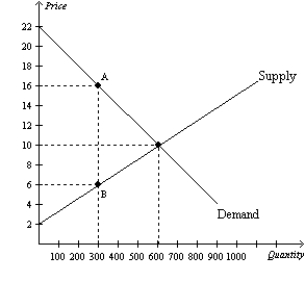 -Refer to Figure 8-6. When the tax is imposed in this market, sellers effectively pay what amount of the $10 tax?
(Multiple Choice)
4.9/5 (37)
Figure 8-9
The vertical distance between points A and C represents a tax in the market.
-Refer to Figure 8-9. The imposition of the tax causes the quantity sold to
(Multiple Choice)
4.8/5 (30)
For a good that is taxed, the area on the relevant supply-and-demand graph that represents government's tax revenue is
(Multiple Choice)
4.8/5 (39)
In the market for widgets, the supply curve is the typical upward-sloping straight line, and the demand curve is the typical downward-sloping straight line. The equilibrium quantity in the market for widgets is 250 per month when there is no tax. Then a tax of $6 per widget is imposed. As a result, the government is able to raise $750 per month in tax revenue. We can conclude that the after-tax quantity of widgets is
(Multiple Choice)
4.9/5 (30)
Suppose the tax on automobile tires is increased so that the tax goes from being a "medium" tax to being a "large" tax. As a result, it is likely that
(Multiple Choice)
4.8/5 (45)
Suppose a tax of $0.10 per unit on a good creates a deadweight loss of $100. If the tax is increased to $0.25 per unit, the deadweight loss from the new tax would be
(Multiple Choice)
4.9/5 (43)
Figure 8-11 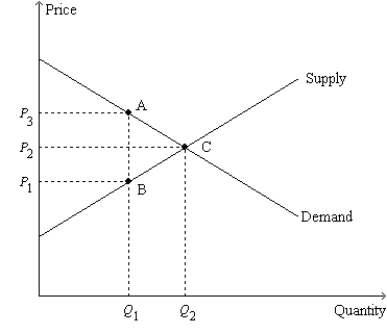 -Refer to Figure 8-11. Suppose Q1 = 4; Q2 = 7; P1 = $6; P2 = $8; and P3 = $10. Then the deadweight loss of the tax is
(Multiple Choice)
4.8/5 (35)
Filters
- Essay(0)
- Multiple Choice(0)
- Short Answer(0)
- True False(0)
- Matching(0)