Exam 8: Applications: the Costs of Taxation
Exam 1: Ten Principles of Economics455 Questions
Exam 2: Thinking Like an Economist643 Questions
Exam 3: Interdependence and the Gains From Trade547 Questions
Exam 4: The Market Forces of Supply and Demand693 Questions
Exam 5: Elasticity and Its Application626 Questions
Exam 6: Supply, Demand, and Government Policies668 Questions
Exam 7: Consumers, Producers, and the Efficiency of Markets547 Questions
Exam 8: Applications: the Costs of Taxation509 Questions
Exam 9: Application: International Trade521 Questions
Exam 10: Externalities543 Questions
Exam 11: Public Goods and Common Resources452 Questions
Exam 12: The Design of the Tax System664 Questions
Exam 13: The Costs of Production649 Questions
Exam 14: Firms in Competitive Markets604 Questions
Exam 15: Monopoly662 Questions
Exam 16: Monopolistic Competition649 Questions
Exam 17: Oligopoly522 Questions
Exam 18: The Markets for the Factors of Production592 Questions
Exam 19: Earnings and Discrimination511 Questions
Exam 20: Income Inequality and Poverty478 Questions
Exam 21: The Theory of Consumer Choice570 Questions
Exam 22: Frontiers in Microeconomics461 Questions
Exam 23: Measuring a Nation S Income547 Questions
Exam 24: Measuring the Cost of Living565 Questions
Exam 25: Production and Growth527 Questions
Exam 26: Saving, Investment, and the Financial System637 Questions
Exam 27: Tools of Finance534 Questions
Exam 28: Unemployment and Its Natural Rate701 Questions
Exam 29: The Monetary System540 Questions
Exam 30: Money Growth and Inflation504 Questions
Exam 31: Open-Economy Macroeconomics: Basic Concepts540 Questions
Exam 32: A Macroeconomic Theory of the Open Economy511 Questions
Exam 33: Aggregate Demand and Aggregate Supply572 Questions
Exam 34: The Influence of Monetary and Fiscal Policy on Aggregate Demand523 Questions
Exam 35: The Short-Run Tradeoff Between Inflation and Unemployment536 Questions
Exam 36: Six Debates Over Macroeconomic Policy354 Questions
Select questions type
Assume the supply curve for diapers is a typical, upward-sloping straight line, and the demand curve for diapers is a typical, downward-sloping straight line. Suppose the equilibrium quantity in the market for diapers is 1,000 per month when there is no tax. Then a tax of $0.50 per diaper is imposed. The effective price paid by buyers increases from $1.50 to $1.90 and the effective price received by sellers falls from $1.50 to $1.40. The government's tax revenue amounts to $475 per month. Which of the following statements is correct?
(Multiple Choice)
4.9/5  (35)
(35)
Taxes on labor tend to increase the number of hours that people choose to work.
(True/False)
4.9/5 (45)
Figure 8-26 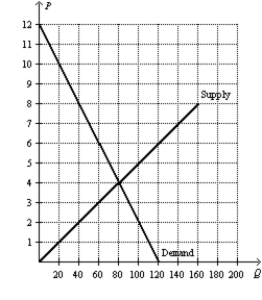 -Refer to Figure 8-26. How much is consumer surplus at the market equilibrium?
(Essay)
4.8/5 (36)
A tax raises the price received by sellers and lowers the price paid by buyers.
(True/False)
4.7/5 (36)
Figure 8-26
-Refer to Figure 8-26. Suppose the government places a $3 tax per unit on this good. What price will sellers receive for the good after the tax is imposed?
(Essay)
4.9/5 (43)
Figure 8-12 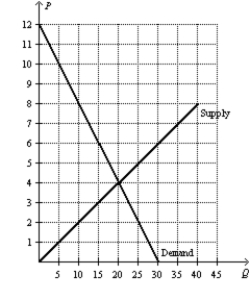 -Refer to Figure 8-12. Suppose a $3 per-unit tax is placed on this good. The tax causes the price received by sellers to
(Multiple Choice)
4.8/5 (44)
Figure 8-13 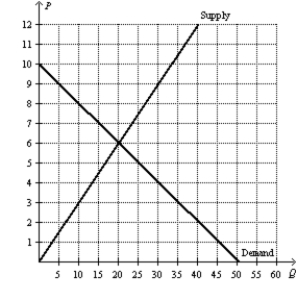 -Refer to Figure 8-13. Suppose the government places a $5 per-unit tax on this good. The loss of producer surplus resulting from this tax is
(Multiple Choice)
5.0/5 (35)
Who once said that taxes are the price we pay for a civilized society?
(Multiple Choice)
4.9/5 (28)
Figure 8-21 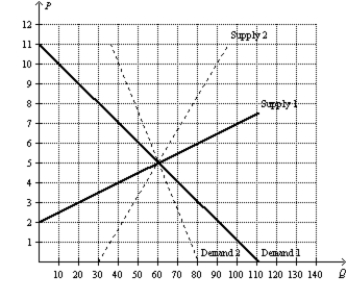 -Refer to Figure 8-21. Suppose the government places a $3 per-unit tax on this good. The smallest deadweight loss from the tax would occur in a market where demand is represented by
(Multiple Choice)
4.8/5 (39)
Figure 8-7
The vertical distance between points A and B represents a tax in the market. 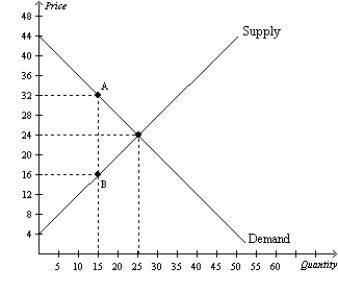 -Refer to Figure 8-7. Suppose a 20th unit of the good were sold by a seller to a buyer. Which of the following statements is correct?
(Multiple Choice)
4.9/5 (41)
Figure 8-25 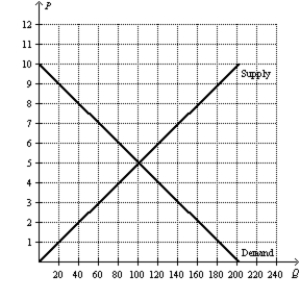 -Refer to Figure 8-25. How much is total surplus at the market equilibrium?
(Short Answer)
4.8/5 (33)
Figure 8-14 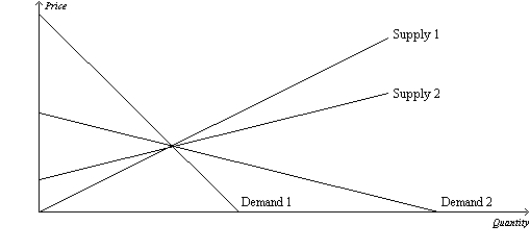 -Refer to Figure 8-14. Which of the following statements is not correct?
(Multiple Choice)
4.7/5 (36)
Figure 8-10 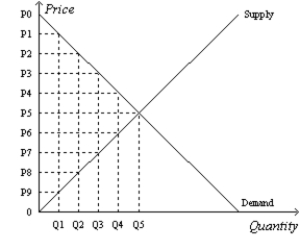 -Refer to Figure 8-10. Suppose the government imposes a tax that reduces the quantity sold in the market after the tax to Q2. The deadweight loss of the tax is
(Multiple Choice)
4.9/5 (43)
The benefit that government receives from a tax is measured by
(Multiple Choice)
4.9/5 (36)
Figure 8-11 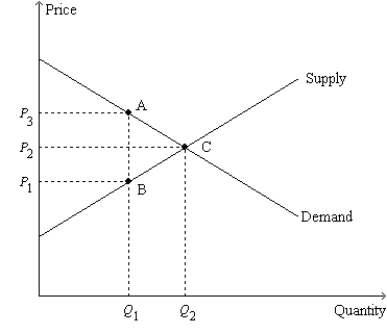 -Refer to Figure 8-11. Neither a shift of the demand curve nor a shift of the supply curve is shown on the figure. However, we know that, when the tax is imposed,
(Multiple Choice)
4.8/5 (40)
The demand for energy drinks is more elastic than the demand for milk. Would a tax on energy drinks or a tax on milk have a larger deadweight loss? Explain.
(Essay)
5.0/5 (28)
Figure 8-3
The vertical distance between points A and C represents a tax in the market. 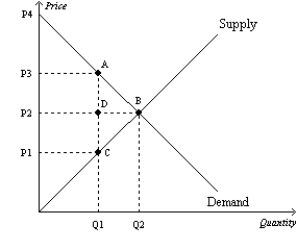 -Refer to Figure 8-3. The loss in producer surplus caused by the tax is measured by the area
(Multiple Choice)
4.9/5 (51)
Figure 8-13
-Refer to Figure 8-13. Suppose the government places a $5 per-unit tax on this good. The tax causes the price paid by buyers to
(Multiple Choice)
4.8/5 (46)
Filters
- Essay(0)
- Multiple Choice(0)
- Short Answer(0)
- True False(0)
- Matching(0)