Exam 8: Applications: the Costs of Taxation
Exam 1: Ten Principles of Economics455 Questions
Exam 2: Thinking Like an Economist643 Questions
Exam 3: Interdependence and the Gains From Trade547 Questions
Exam 4: The Market Forces of Supply and Demand693 Questions
Exam 5: Elasticity and Its Application626 Questions
Exam 6: Supply, Demand, and Government Policies668 Questions
Exam 7: Consumers, Producers, and the Efficiency of Markets547 Questions
Exam 8: Applications: the Costs of Taxation509 Questions
Exam 9: Application: International Trade521 Questions
Exam 10: Externalities543 Questions
Exam 11: Public Goods and Common Resources452 Questions
Exam 12: The Design of the Tax System664 Questions
Exam 13: The Costs of Production649 Questions
Exam 14: Firms in Competitive Markets604 Questions
Exam 15: Monopoly662 Questions
Exam 16: Monopolistic Competition649 Questions
Exam 17: Oligopoly522 Questions
Exam 18: The Markets for the Factors of Production592 Questions
Exam 19: Earnings and Discrimination511 Questions
Exam 20: Income Inequality and Poverty478 Questions
Exam 21: The Theory of Consumer Choice570 Questions
Exam 22: Frontiers in Microeconomics461 Questions
Exam 23: Measuring a Nation S Income547 Questions
Exam 24: Measuring the Cost of Living565 Questions
Exam 25: Production and Growth527 Questions
Exam 26: Saving, Investment, and the Financial System637 Questions
Exam 27: Tools of Finance534 Questions
Exam 28: Unemployment and Its Natural Rate701 Questions
Exam 29: The Monetary System540 Questions
Exam 30: Money Growth and Inflation504 Questions
Exam 31: Open-Economy Macroeconomics: Basic Concepts540 Questions
Exam 32: A Macroeconomic Theory of the Open Economy511 Questions
Exam 33: Aggregate Demand and Aggregate Supply572 Questions
Exam 34: The Influence of Monetary and Fiscal Policy on Aggregate Demand523 Questions
Exam 35: The Short-Run Tradeoff Between Inflation and Unemployment536 Questions
Exam 36: Six Debates Over Macroeconomic Policy354 Questions
Select questions type
Figure 8-9
The vertical distance between points A and C represents a tax in the market. 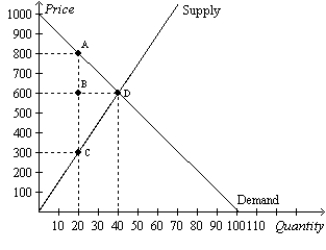 -Refer to Figure 8-9. The amount of the tax on each unit of the good is
(Multiple Choice)
4.8/5  (34)
(34)
Figure 8-28 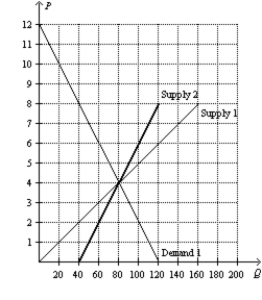 -Refer to Figure 8-28. Suppose that Market A is characterized by Demand 1 and Supply 1, and Market B is characterized by Demand 1 and Supply 2. If an identical tax is imposed on each market, the tax will create a larger deadweight loss in which market? Explain.
(Essay)
4.9/5 (33)
If the tax on a good is increased from $0.30 per unit to $0.90 per unit, the deadweight loss from the tax
(Multiple Choice)
4.8/5 (38)
Suppose Rebecca needs a dog sitter so that she can travel to her sister's wedding. Rebecca values dog sitting for the weekend at $200. Susan is willing to dog sit for Rebecca so long as she receives at least $175. Rebecca and Susan agree on a price of $185. Suppose the government imposes a tax of $30 on dog sitting. The tax has made Rebecca and Susan worse off by a total of
(Multiple Choice)
4.8/5 (33)
Suppose a tax is imposed on the sellers of fast-food French fries. The burden of the tax will
(Multiple Choice)
4.9/5 (33)
As the price elasticities of supply and demand increase, the deadweight loss from a tax increases.
(True/False)
4.8/5 (36)
Figure 8-26 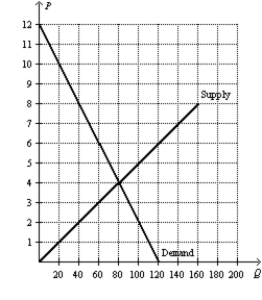 -Refer to Figure 8-26. Suppose the government places a $3 tax per unit on this good. How much is total surplus after the tax is imposed?
(Essay)
4.7/5 (31)
Figure 8-9
The vertical distance between points A and C represents a tax in the market.
-Refer to Figure 8-9. The loss of producer surplus as a result of the tax is
(Multiple Choice)
4.9/5 (39)
When the government imposes taxes on buyers and sellers of a good, society loses some of the benefits of market efficiency.
(True/False)
4.8/5 (39)
Figure 8-29 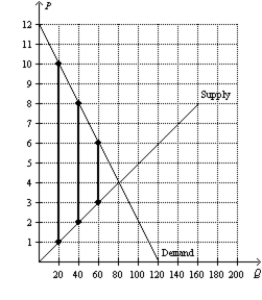 -Refer to Figure 8-29. If you were a policymaker choosing between a $3, $6, or $9 tax, which would you choose and why?
(Essay)
4.9/5 (34)
The benefit to sellers of participating in a market is measured by the
(Multiple Choice)
4.7/5 (37)
Figure 8-8
Suppose the government imposes a $10 per unit tax on a good. 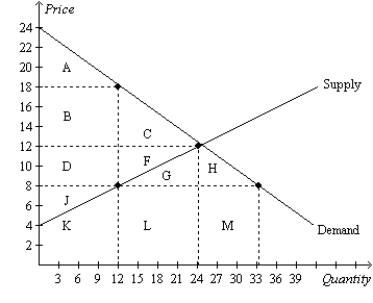 -Refer to Figure 8-8. One effect of the tax is to
(Multiple Choice)
4.8/5 (40)
If the government imposes a $3 tax in a market, the buyers and sellers will share an equal burden of the tax.
(True/False)
4.9/5 (35)
Figure 8-9
The vertical distance between points A and C represents a tax in the market.
-Refer to Figure 8-9. The total surplus with the tax is
(Multiple Choice)
4.9/5 (29)
Scenario 8-3
Suppose the market demand and market supply curves are given by the equations:  -Refer to Scenario 8-3. What are the equilibrium price and equilibrium quantity in this market?
(Essay)
4.8/5 (45)
Which of the following statements correctly describes the relationship between the size of the deadweight loss and the amount of tax revenue as the size of a tax increases from a small tax to a medium tax and finally to a large tax?
(Multiple Choice)
4.8/5 (39)
Illustrate on three demand-and-supply graphs how the size of a tax (small, medium and large) can alter total revenue and deadweight loss.
(Essay)
4.9/5 (31)
Figure 8-7
The vertical distance between points A and B represents a tax in the market. 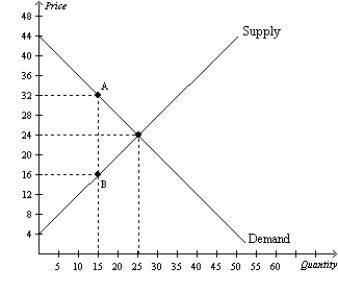 -Refer to Figure 8-7. As a result of the tax, buyers effectively pay
(Multiple Choice)
4.7/5 (36)
Filters
- Essay(0)
- Multiple Choice(0)
- Short Answer(0)
- True False(0)
- Matching(0)