Exam 3: Numerical Descriptive Measures
Exam 1: Defining and Collecting Data205 Questions
Exam 2: Organizing and Visualizing Variables212 Questions
Exam 3: Numerical Descriptive Measures163 Questions
Exam 4: Basic Probability171 Questions
Exam 5: Discrete Probability Distributions117 Questions
Exam 6: The Normal Distribution144 Questions
Exam 7: Sampling Distributions127 Questions
Exam 8: Confidence Interval Estimation187 Questions
Exam 9: Fundamentals of Hypothesis Testing: One-Sample Tests177 Questions
Exam 10: Two-Sample Tests300 Questions
Exam 11: Chi-Square Tests128 Questions
Exam 12: Simple Linear Regression209 Questions
Exam 13: Multiple Regression307 Questions
Exam 14: Business Analytics254 Questions
Select questions type
Which descriptive summary measures are resistant statistics?
(Multiple Choice)
4.9/5  (42)
(42)
SCENARIO 3-7
In a recent academic year, many public universities in the United States raised tuition and fees due to
a decrease in state subsidies.The change in the cost of tuition, a shared dormitory room, and the most popular meal plan from the previous academic year for a sample of 10 public universities were as follows: $1,589, $593, $1,223, $869, $423, $1,720, $708, $1425, $922 and $308.
-Referring to Scenario 3-7, what is the skewness statistic of the change in the cost?
(Short Answer)
4.8/5 (33)
SCENARIO 3-3
The ordered array below represents the number of vitamin supplements sold by a health food store in a sample of 16 days. Note: For this sample, the sum of the values is 448, and the sum of the squared differences between each value and the mean is 812.
-Referring to Scenario 3-3, the coefficient of variation of the number of vitamin supplements sold in this sample is percent.
(Short Answer)
4.8/5 (42)
SCENARIO 3-3
The ordered array below represents the number of vitamin supplements sold by a health food store in a sample of 16 days. Note: For this sample, the sum of the values is 448, and the sum of the squared differences between each value and the mean is 812.
-Referring to Scenario 3-3, the first quartile of the number of vitamin supplements sold in this sample is _.
(Short Answer)
4.9/5 (27)
In a right skewed distribution, the distance from X smallest to Q1 isfrom Q3 to X largest.
(Short Answer)
4.9/5 (30)
SCENARIO 3-1
Health care issues are receiving much attention in both academic and political arenas.A sociologist recently conducted a survey of citizens over 60 years of age whose net worth is too high to qualify for Medicaid.The ages of 25 senior citizens were as follows: 60 61 62 63 64 65 66 68 68 69 70 73 73 74 75 76 76 81 81 82 86 87 89 90 92
-Referring to Scenario 3-1, calculate the variance of the ages of the senior citizens correct to the nearest hundredth of a year squared.
(Short Answer)
4.9/5 (40)
If the distribution of a data set were perfectly symmetrical, the distance from Q1 to the median would always equal the distance from Q3 to the median in a boxplot.
(True/False)
4.9/5 (32)
In a set of numerical data, the value for Q3 can never be smaller than the value forQ1.
(True/False)
5.0/5 (42)
SCENARIO 3-7
In a recent academic year, many public universities in the United States raised tuition and fees due to
a decrease in state subsidies.The change in the cost of tuition, a shared dormitory room, and the most popular meal plan from the previous academic year for a sample of 10 public universities were as follows: $1,589, $593, $1,223, $869, $423, $1,720, $708, $1425, $922 and $308.
-Referring to Scenario 3-7, is the change in the cost right- or left-skewed?
(Short Answer)
5.0/5 (33)
If a set of data is perfectly symmetrical, the arithmetic mean must be identical to the median.
(True/False)
4.9/5 (27)
SCENARIO 3-3
The ordered array below represents the number of vitamin supplements sold by a health food store in a sample of 16 days. Note: For this sample, the sum of the values is 448, and the sum of the squared differences between each value and the mean is 812.
-Referring to Scenario 3-3, what type of shape does the distribution of the sample appear to have?
(Short Answer)
4.9/5 (25)
A manufacturer of flashlight batteries took a sample of 130 batteries from a day's production and used them continuously until they were drained.The number of hours until failure is recorded.Given below is the boxplot of the number of hours it took to drain each of the 130 batteries.The distribution of the number of hours is 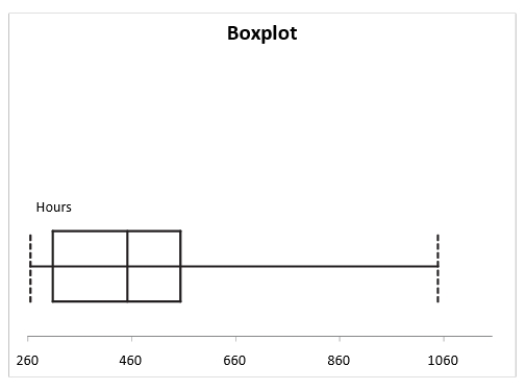
(Multiple Choice)
4.7/5 (40)
SCENARIO 3-6
The rate of return of an Internet Service Provider over a 10-year period are: 10.25\%,12.64\%,8.37\%, 9.29\%,6.23\%,42.53\%,29.23\%,15.25\%,21.52\%,-2.35\% .
-Referring to Scenario 3-6, what is the shape of the distribution for the rate of return?
(Short Answer)
4.8/5 (35)
SCENARIO 3-3
The ordered array below represents the number of vitamin supplements sold by a health food store in a sample of 16 days. Note: For this sample, the sum of the values is 448, and the sum of the squared differences between each value and the mean is 812.
-Referring to Scenario 3-3, the interquartile range of the number of vitamin supplements sold in this sample is .
(Short Answer)
4.9/5 (32)
SCENARIO 3-2
The data below represent the number of grams of carbohydrates in a serving of breakfast cereal in a sample of 11 different servings.
-Referring to Scenario 3-2, the range in the carbohydrate amounts is grams.
(Short Answer)
4.9/5 (37)
Which measure of central tendency can be used for both numerical and categorical variables?
(Multiple Choice)
4.8/5 (35)
SCENARIO 3-1
Health care issues are receiving much attention in both academic and political arenas.A sociologist recently conducted a survey of citizens over 60 years of age whose net worth is too high to qualify for Medicaid.The ages of 25 senior citizens were as follows: 60 61 62 63 64 65 66 68 68 69 70 73 73 74 75 76 76 81 81 82 86 87 89 90 92
-Referring to Scenario 3-1, determine the median age of the senior citizens.
(Short Answer)
4.8/5 (47)
According to the empirical rule, if the data form a "bell-shaped" normal distribution, percent of the observations will be contained within 2 standard deviations around the arithmetic mean.
(Multiple Choice)
4.9/5 (41)
SCENARIO 3-8
The following table represents the assets in billions of dollars of the five largest bond funds sometime in the past.
-Referring to Scenario 3-8, what are the variance and standard deviation for this population?
(Short Answer)
4.8/5 (32)
SCENARIO 3-10
The population of eight analysts at a software firm were asked to estimate the reuse rate when developing a new software system.The following data are given as a percentage of the total code written for a software system that is part of the reuse database.
-Referring to Scenario 3-10, what are the variance and standard deviation of the total code that is part of the reuse database?
(Short Answer)
4.9/5 (35)
Filters
- Essay(0)
- Multiple Choice(0)
- Short Answer(0)
- True False(0)
- Matching(0)