Exam 3: Numerical Descriptive Measures
Exam 1: Defining and Collecting Data205 Questions
Exam 2: Organizing and Visualizing Variables212 Questions
Exam 3: Numerical Descriptive Measures163 Questions
Exam 4: Basic Probability171 Questions
Exam 5: Discrete Probability Distributions117 Questions
Exam 6: The Normal Distribution144 Questions
Exam 7: Sampling Distributions127 Questions
Exam 8: Confidence Interval Estimation187 Questions
Exam 9: Fundamentals of Hypothesis Testing: One-Sample Tests177 Questions
Exam 10: Two-Sample Tests300 Questions
Exam 11: Chi-Square Tests128 Questions
Exam 12: Simple Linear Regression204 Questions
Exam 13: Multiple Regression307 Questions
Exam 14: Business Analytics254 Questions
Select questions type
SCENARIO 3-3
The ordered array below represents the number of vitamin supplements sold by a health food store in a sample of 16 days. Note: For this sample, the sum of the values is 448, and the sum of the squared differences between each value and the mean is 812.
-Referring to Scenario 3-3, the arithmetic mean of the number of vitamin supplements sold in this sample is _.
Free
(Essay)
4.7/5  (36)
(36)
Correct Answer: Verified
28
3-22 Numerical Descriptive Measures
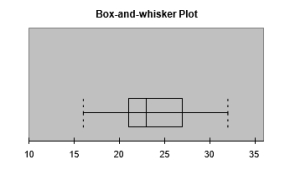
The ordered array below represents the number of cargo manifests approved by customs inspectors of the Port of New York in a sample of 35 days:
16, 17, 18, 18, 19, 20, 20, 21, 21, 21, 22, 22, 22, 22, 23, 23, 23, 23, 24, 24, 24, 25, 25, 26, 26, 26, 27,
28, 28, 29, 29, 31, 31, 32, 32
Note: For this sample, the sum of the values is 838, and the sum of the squared differences between each value and the mean is 619.89.
-Referring to Scenario 3-4, construct a boxplot of this sample.
Free
(Essay)
4.7/5 (36)
Correct Answer:Verified
SCENARIO 3-11
Given below are the closing prices for the Dow Jones Industrial Average (DJIA) and the Standard & Poor's (S&P) 500 Index over 10-weeks sometime in the past. Dow Jones 10,421 10,110 9,862 10,475 9,920 10,592 11,213 10,933 11,134 10,316 S\&P 500 1,379 1,356 1,343 1,410 1,389 1,463 1,529 1,499 1,516 1,355
-Referring to Scenario 3-11, you will expect an increase in the DJIA to be associated with
Free
(Multiple Choice)
4.8/5 (31)
Correct Answer:Verified
A
You were told that the 1st, 2nd and 3rd quartiles of female students' weight at a major university are 95 lbs., 125 lbs., and 138 lbs...What percentage of the students weigh more than 138 lbs...?
(Essay)
4.7/5 (34)
3-22 Numerical Descriptive Measures
The ordered array below represents the number of cargo manifests approved by customs inspectors of the Port of New York in a sample of 35 days:
16, 17, 18, 18, 19, 20, 20, 21, 21, 21, 22, 22, 22, 22, 23, 23, 23, 23, 24, 24, 24, 25, 25, 26, 26, 26, 27,
28, 28, 29, 29, 31, 31, 32, 32
Note: For this sample, the sum of the values is 838, and the sum of the squared differences between each value and the mean is 619.89.
-Referring to Scenario 3-4, the five-number summary for the data in the customs sample consists of , , , _, .
(Essay)
4.7/5 (38)
SCENARIO 3-7
In a recent academic year, many public universities in the United States raised tuition and fees due to
a decrease in state subsidies.The change in the cost of tuition, a shared dormitory room, and the most popular meal plan from the previous academic year for a sample of 10 public universities were as follows: $1,589, $593, $1,223, $869, $423, $1,720, $708, $1425, $922 and $308.
-Referring to Scenario 3-7, what are the (absolute values of) the Z scores of the change in cost?
(Essay)
4.9/5 (29)
SCENARIO 3-3
The ordered array below represents the number of vitamin supplements sold by a health food store in a sample of 16 days. Note: For this sample, the sum of the values is 448, and the sum of the squared differences between each value and the mean is 812.
-Referring to Scenario 3-3, the interquartile range of the number of vitamin supplements sold in this sample is .
(Essay)
4.8/5 (35)
You were told that the 1st, 2nd and 3rd quartiles of female students' weight at a major university are 95 lbs., 125 lbs., and 138 lbs...What percentage of the students weigh less than 95 lbs...?
(Essay)
4.8/5 (41)
SCENARIO 3-8
The following table represents the assets in billions of dollars of the five largest bond funds sometime in the past.
-Referring to Scenario 3-8, what are the variance and standard deviation for this population?
(Essay)
4.8/5 (33)
The geometric mean is useful in measuring the rate of change of a variable over time.
(True/False)
5.0/5 (29)
You were told that the 1st, 2nd and 3rd quartiles of female students' weight at a major university are 95 lbs., 125 lbs., and 138 lbs.What percentage of the students weigh more than 125 lbs...?
(Essay)
4.8/5 (30)
The smaller the spread of scores around the arithmetic mean,
(Multiple Choice)
4.9/5 (40)
SCENARIO 3-1
Health care issues are receiving much attention in both academic and political arenas.A sociologist recently conducted a survey of citizens over 60 years of age whose net worth is too high to qualify for Medicaid.The ages of 25 senior citizens were as follows: 60 61 62 63 64 65 66 68 68 69 70 73 73 74 75 76 76 81 81 82 86 87 89 90 92
-Referring to Scenario 3-1, calculate the coefficient of variation of the ages of the senior citizens.
(Essay)
4.8/5 (44)
SCENARIO 3-1
Health care issues are receiving much attention in both academic and political arenas.A sociologist recently conducted a survey of citizens over 60 years of age whose net worth is too high to qualify for Medicaid.The ages of 25 senior citizens were as follows: 60 61 62 63 64 65 66 68 68 69 70 73 73 74 75 76 76 81 81 82 86 87 89 90 92
-Referring to Scenario 3-1, what type of shape does the distribution of the sample appear to have?
(Essay)
4.9/5 (30)
SCENARIO 3-2
The data below represent the number of grams of carbohydrates in a serving of breakfast cereal in a sample of 11 different servings.
-Referring to Scenario 3-2, the first quartile of the carbohydrate amounts is grams.
(Essay)
4.9/5 (27)
SCENARIO 3-2
The data below represent the number of grams of carbohydrates in a serving of breakfast cereal in a sample of 11 different servings.
-Referring to Scenario 3-2, the interquartile range in the carbohydrate amounts is grams.
(Essay)
4.9/5 (33)
SCENARIO 3-1
Health care issues are receiving much attention in both academic and political arenas.A sociologist recently conducted a survey of citizens over 60 years of age whose net worth is too high to qualify for Medicaid.The ages of 25 senior citizens were as follows: 60 61 62 63 64 65 66 68 68 69 70 73 73 74 75 76 76 81 81 82 86 87 89 90 92
-Referring to Scenario 3-1, identify which of the following is the correct statement.
(Multiple Choice)
4.9/5 (30)
SCENARIO 3-11
Given below are the closing prices for the Dow Jones Industrial Average (DJIA) and the Standard & Poor's (S&P) 500 Index over 10-weeks sometime in the past. Dow Jones 10,421 10,110 9,862 10,475 9,920 10,592 11,213 10,933 11,134 10,316 S\&P 500 1,379 1,356 1,343 1,410 1,389 1,463 1,529 1,499 1,516 1,355
-Referring to Scenario 3-11, how will you classify the linear relationship between the DJIA and the S&P 500 index?
(Multiple Choice)
4.8/5 (38)
SCENARIO 3-13
Energy drink consumption has continued to gain in popularity since the 1997 debut of Red Bull, the current leader in the energy drink market.Given below are the exam scores and the number of 12- ounce energy drinks consumed within a week prior to the exam of 10 college students. Exam Scores 75 92 84 64 64 86 81 61 73 93 Number of Drinks 5 3 2 4 2 7 3 0 1 0
-Referring to Scenario 3-13, what is the sample correlation coefficient between the exam scores and the number of energy drinks consumed?
(Essay)
4.8/5 (32)
In exploratory data analysis, a boxplot can be used to illustrate the median, quartiles, and extreme values.
(True/False)
4.9/5 (31)
Filters
- Essay(0)
- Multiple Choice(0)
- Short Answer(0)
- True False(0)
- Matching(0)